STA 2023 Written Homework #3
Hello, dear friend, you can consult us at any time if you have any questions, add WeChat: daixieit
STA 2023
Written Homework #3
This assignment is due at 11:59 pm (Beijing time) on the date listed on Moodle but you should work on it throughout the week as you finish each Section (the questions are labeled by Section number). Write all work on separate paper,scan, and submit the assignment to Moodle. Be sure to show all steps for full credit.
1. Section 5.1
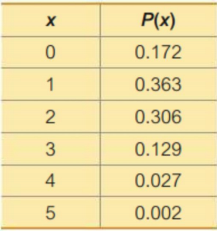
The table below describes the numbers of adults in groups of five who reported sleepwalking.
Find the mean and standard deviation for the numbers of sleepwalkers in groups of five.
2. Section 5.1
Use the same probability distribution from Question #1.
(a) Use the Range Rule of Thumb to determine whether 4 is a significantly high number of sleepwalkers in a group of 5 adults. Show your work.
(b) Use probabilities to determine whether 4 is a significantly high number of sleepwalkers in a group of 5 adults. Show your work.
3. Section 5.2
A survey sponsored by the Vision Council showed that 79% of adults need correction for their eyesight. If 20 adults are randomly selected, find the probability that at least 19 of them need correction for their eyesight. Is 19 a significantly high number of adults needing eyesight correction? How did you determine this?
4. Section 5.2
Assume that 16 women who have just delivered a baby are randomly selected in a hospital. (Assume the likelihood of having a girl is 50%).
(a) Find the mean and standard deviation for the number of girls in 16 births.
(b) Use the Range Rule of Thumb to find the values separating results that are significantly low and significantly high.
5. Section 5.3
A classical example of the Poisson distribution involves the number of deaths caused by horse kicks to men in the Prussian army between 1875 and 1894. Data for 14 corps were combined for the 20-year period and the 280 corps-years included a total of 196 deaths. After finding the mean number of deaths per corps-year, find the probability that a randomly selected corps-year has the following number of deaths:
(a) Zero
(b) One
(c) Two
(d) Three
(e) Four
The actual results consisted of these frequencies: 0 deaths (in 144 of the corps-years), 1 death (in 91 corps-years), 2 deaths (in 32 corps-years), 3 deaths (in 11 corps-years), and 4 deaths (in 2 corps-years). Compare the actual results to those expected by using the Poisson probabilities. Does the Poisson distribution serve as a good tool for predicting the actual results?
2023-08-04