ECS607U Data Mining Winter Examination Period 2022
Hello, dear friend, you can consult us at any time if you have any questions, add WeChat: daixieit
Winter Examination Period 2022 — January — Semester A
ECS607U Data Mining
Duration: 3 hours
Question 1
(a) Suppose you are hired by a bank as a data scientist. This bank has just launched a new credit card with good benefits, however, the applicants need to satisfy certain criteria to be approved for this credit card. Moreover, if approved, the credit limit (i.e. the maximum amount you can borrow) will be decided based on the financial status of the applicant. So far, the applications have been assessed manually. Your task is to automate this process by analysing the data available. Table 1 shows ten (hypothetical) applications with their outcome.

(i) Your first task is to predict whether a given application should be approved or declined. What type of data mining task is this (classification, regression, clustering, association analysis, etc.)? Briefly justify your answer.
(ii) From all available features in Table 1, which ones should be used as input features? Are there any features that should not be used as input?
(iii) Your next task is to predict the appropriate credit limit for approved applications. Assume that credit limit is a continuous variable. You can see several missing values under the column “Credit Limit”. Explain why replacing these missing values with a numeric value such as feature mean does not make sense in this scenario.
(iv) However, handling missing values is necessary before training a model to predict the credit limit. What is the most appropriate strategy to eliminate missing values in this particular case? Briefly explain your answer.
[10 marks — word limit 250]
(b) Figure 1 shows the decision tree created by training a model on credit card application data not available in Table 1.
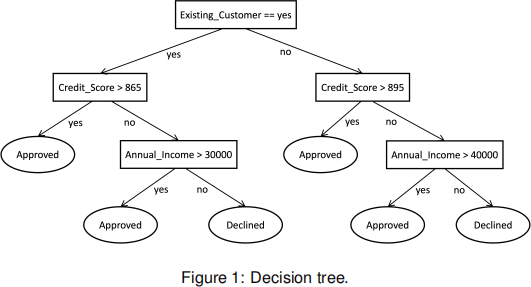
(i) Obtain the predicted outcome for each application recorded in Table 1 using this decision tree and calculate the accuracy.
(ii) Draw the confusion matrix for this task. [10 marks]
(c) Your fellow employee states that “credit limit is positively correlated with credit score” . What numeric metric can be used to evaluate the validity of this statement? If the statement is indeed true, specify the possible range in which the metric value would lie (e.g. [a, b] where a, b 2 IR). You are not required to calculate the metric value.
[5 marks — word limit 100]
Question 2
(a) You are given a dataset that shows total sales per month in £ for an online store (Table 2).

(i) Group the sales data into three equal frequency bins and perform smoothing by bin boundaries.
(ii) Compute the three quartiles Q1, Q2 and Q3 for the full data distribution.
(iii) Sketch a boxplot to summarise sales data. Indicate all important values on the plot. Are there any outlier points that should be indicated separately? Your answer should be backed by calculations.
[10 marks — word limit 100]
(b) Suppose you have a list of 2D coordinates [(2, -1), (-1, 2), (-2, 1), (4, 0)]. Your goal is to cluster these points into two distinct clusters using the K-means algorithm. The centroids of two clusters A and B are initialised as (-2, -1) and (3, 1), respectively.
(i) Using Euclidean distance as the distance measure, determine which data points
will be assigned to each cluster at the start of the first iteration of K-means algorithm (assign step).
(ii) Move the centroid of each cluster to the average (mean) location of the data points assigned to that cluster and report the coordinates of the centroids of clusters A and B at the end of first iteration (move step).
(iii) In your own words, explain what is meant by the “convergence” of the K-means algorithm.
[10 marks — word limit 100]
(c) How does principal component analysis (PCA) help in visualising high-dimensional data? Explain in your own words.
[5 marks — word limit 100]
Question 3
(a) Suppose that a network of libraries maintains a data warehouse consisting of dimen- sions time, resource, membership and location. It has one measure article count . Imagine that time dimension has four levels {day <week <month <year}, resource dimension has three levels {article <journal <publisher}, membership dimension has one level {all members} and location dimension has three levels {town <district
 <county}.
(i) Specify two key differences between a data warehouse and an operational database.
(ii) Draw a star star schema diagram for the library data warehouse outlined above.
(iii) Compute the total number of cuboids that can be generated from the main data cube.
(iv) We need to obtain the article count by processing a query on {journal=“Nature”, county=“Essex”} for a specific “year=2020” considering all the members. Suppose that we have a materialised cuboid {year, article, all members, town}
 . What specific OLAP operations should be performed in order to obtain the total number of articles in Nature journal that were read by all members in Essex during the year 2020.
[15 marks — word limit 150]
(b) Consider the graph in Figure 2 that displays the links between five webpages.

(i) Without any calculation, by observing the above graph, which pairs of web pages do you expect to have equal PageRank scores? Briefly explain why.
(ii) Set up the equations to compute π(i) for all nodes, where i = {1, ..., 5} corre- sponds to the node index. Assume that the teleportation probability is set to 0.2.
(iii) Try to solve the equations that you obtained above if you have time and verify whether your results match your expectation in part (i) of the question.
[10 marks — word limit 100]
Question 4
(a) Table 3 shows the favourite sports of eight selected students. Answer the following questions accordingly. Make sure to provide your working, or write down your thinking.
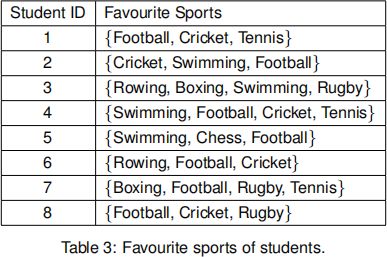
(i) Compute the support of the itemset {Football, Cricket}. Is this a frequent itemset? (assume that the minimum support threshold is 0.3)
(ii) Is the association rule {Swimming → Football} considered strong? Your answer should be supported by appropriate calculations. (assume that the minimum support threshold is 0.3 and the minimum confidence threshold is 0.6)
(iii) Compute the Kulczynski measure between the two itemsets {Rowing} and {Rugby}.
[10 marks — word limit 100]
(b) This question is about proximity based outlier detection. Here we are using a K- nearest neighbours (KNN) approach to compute an outlier score for each of the observation in our dataset. Assume that we are given six 2D observations. Table below shows the three nearest neighbours (K=3) for each observation (excluding the observation itself). The neighbours are ordered by ascending euclidean distance (closest neighbour first).
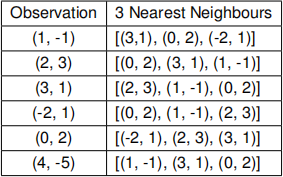
(i) Assume that the outlier score of a given observation is defined as the euclidean distance between that observation and its Kth (=3) neighbour. Compute the outlier score for all the observations.
(ii) Which observation is the most likely outlier? Justify your answer.
[8 marks — word limit 50]
(c) Describe three commonly observed issues in real world databases and provide one strategy each to tackle the issuesidentified.
[7 marks — word limit 150]
2023-08-04