Using "Solver" in Microsoft Excel
Hello, dear friend, you can consult us at any time if you have any questions, add WeChat: daixieit
Using "Solver" in Microsoft Excel
The Solver Add-in is a Microsoft Office Excel add-in program that is available when you install Microsoft Office or
Excel. To use it, however, you need to load it first (see below). Solver is a built-in routine for non-linear curve fitting in Microsoft Excel.
Bringing up Solver: Start Microsoft Excel. In the Microsoft Office 2007 version of Excel Solver shows up in the
Analysis group of the Data tab (Tools or Options on earlier versions). If the Analysis group or "Solver" is not listed, goto Excel Help and search for ―Solver‖ to get instructions on how to load this add-in.
Using Solver for non-linear regression: We'll use sample data for an enzyme kinetic reaction.
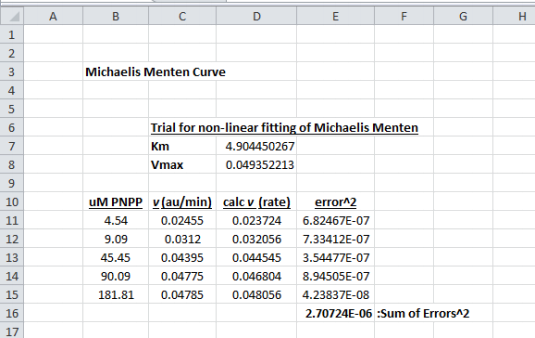
- Set up data as shown below in cells B11-B15 (your substrate concentration) and C11-C15 (your experimentally determined rates), and place trial values of KM and Vmax in D7 and D8, as shown.
- Into cell D11,enter formula: =$D$8*B11/($D$7+B11) (This calculates v (ΔAbs/min) according to the non-linear
Michaelis Menten equation, v = Vmax[S]/(Km + [S]), using the trial values of KM and Vmax in D7 and D8.)
- Copy the D11 formula into cells D12-D15, using the little cross at bottom right of cell D11.
- Into cell E11,enter formula: =(C11-D11)^2 and copy this formula into cells E12-E15
- Into cell E16 enter the sum of cells E11-E15. The formula is: =SUM(E11:E15).
- Enter Solver from the Data tab.
o In the Solver Parameter dialog box that appears, enter $E$16 in the "Set Objective” box (this is the sum of squared errors box),
o and enter $D$7,$D$8 in the "By Changing Variable Cells" box (these are your initial guesses),
o and click on the To: "Min".
o Click on "Solve" and within a second the job is done. Click on OK in the box that appears, and the best values of KM and Vmax will be saved in boxes D7 and D8. For the data below those values are 4.90 uM and 0.0494 au/min for KM and Vmax, respectively (As a check, the sum of squared differences in cellE16 should be 2.707 x 10⁻⁶.)
o Your initial guesses for Km and Vmax should be your best estimates, however, just for curiosity place different initial guesses in cells D7 and D8 and repeat with Solver. You should, of course, get the same final best-fit set of values.
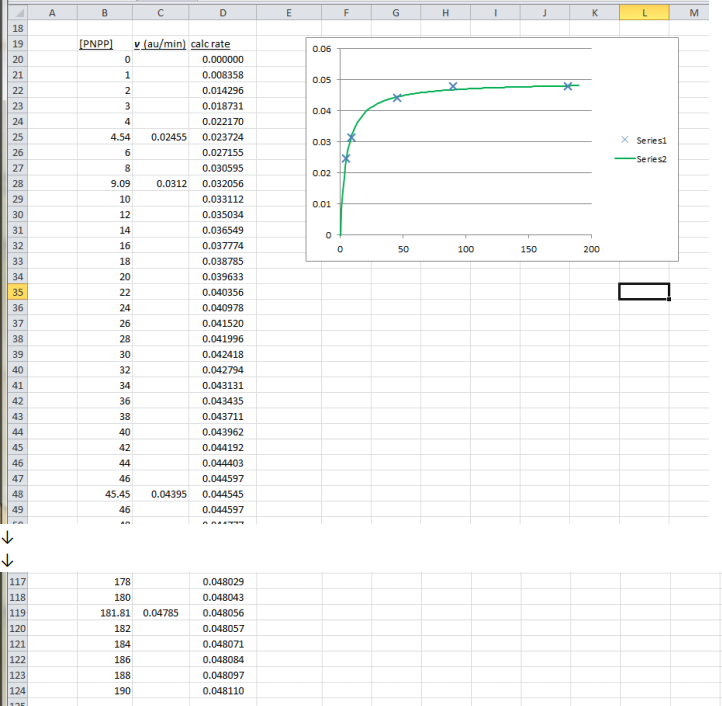
- Compare your actual data points with the points that “Solver” calculated to be the best fit by plotting them together on the same graph.
- You can also generate more data points to generate the best fit smooth curve using the solved KM and Vmax and fitting them into the equation.
- In the worksheet below, the substrate concentration was entered into Column B in small increments (except for the actual data points (substrate concentrations) starting with 0 µM in cell B20 … 4.54 µM in cell= B25 … etc
- In column C, the actual data points for rates (au/min) are entered at the respective substrate concentration starting with 0.02455 at cell = C25. This will be “Series 1” .
- The D20 cell contains the Michaelis-Menten formula: =$D$8*B20/($D$7+B20) which is then copied all the way down until your last data point. This will be “Series 2”. The Km and Vmax values will be set constant with the values solved by “Solver” .
- Plot µM Substrate against both “Series 1” and “Series 2” all on the same scatter plot graph
- Make the Chart type for Series 1 data points as a scatter plot without connecting lines
- Make the Chart type for Series 2 data points as a smooth connecting line with no data markers
- Don’t forget to properly label the axes and give it a title
2023-07-28