CAN404 Social Network Analysis Semester 2, 2022/23
Hello, dear friend, you can consult us at any time if you have any questions, add WeChat: daixieit
CAN404 Social Network Analysis
Project (70%)
I. Semester 2, 2022/23
Analysis of Bitcoin Transaction Trust Mechanism Based on Social Network Analysis
Abstract—Through constructing social network structure at a basis of relationships between Bitcoin users’ transactions and their degree of trust. The essay establishes social network analysis methods and algorithms by Rstudio and various algorithms to contrast the characteristics of bitcoin users’ transaction constitution under distinct trust level and evaluate the reliability of bitcoin trading.
Keywords—social network analysis, bitcoin, trust level, trust mechanism analysis
I. Introduction and project aim
With the rapid development of economy and society, people's trading methods have undergone great changes. Society cannot function without trust which is as indispensable as air. Tradition trust mechanism was trust out of familiarity, but now it has shifted into online traction. The networking of currency and mass traditional commodity transactions has also subtly changed the trust mode of users, from the previous acquaintance trading to more attention to product reviews and store reputation scores. But one fact cannot be changed is that authoritative counterparties are usually more trusted.
As an emerging digital currency and virtual property protected by law, Bitcoin has the characteristics of decentralization, globalization, anonymity. Bitcoin's anonymity also brings many hidden dangers, such as illegal transactions and financial fraud on the Internet. In this context, how to find the most respected trading partner with a higher reputation or authority among all the stakeholders has become the focus on preventing financial fraud. At present, most academic research on Bitcoin focuses on price fluctuations, investment value and blockchain. However, few scholars have studied the trust mechanism in Bitcoin transactions through social network analysis.
This project aims to dig who-trusts-whom network by Rstudio and multiple algorithms to analyze the first explicit weighted signed directed network Bitcoin OTC platform hence protect the interests of users. Members on that platform rate other members in a scale of -10 (trade distrust) to +10 (total trust). The dataset is second-hand data derived from Standford data, contains 5.881 nodes, 35,592 edges and 31,677 attributes[1].
Research questions can be summarized as follows:
(1) What are the structural characteristics of user transaction networks under different levels of trust? What are their differences and similarities?
(2) Which users have a high reputation in the transaction trust network and could be the preferred partners?
(3) What are the locations of users in the network after clustering with different levels of trust?
Key approaches are described below:
(1) Structural analysis: density and centrality.
(2) Community detection: edge betweenness, greedy optimization of modularity, multidimensional scaling, K-Means, and hierarchical clustering.
(3) Link Analysis: PageRank
(4) Proximity Measurement: Neumann Kernel and Shared Nearest Neighbor.
II. Literature review
In 2008, Satoshi Nakamoto published the article "Bitcoin: A Peer-to-Peer Electronic Cash System", which first proposed a decentralized cryptocurrency system based on P2P networks [2]. On January 3, 2009, the Bitcoin system became operational and the Bitcoin genesis block was born. On this block, Satoshi Nakamoto left the headline - The Times 03/Jan/2009 Chancellor on brink of second bailout for banks[3]. In March 2013, market cap the Bitcoin exceeded one billion, and ten years later, the market capitalization of Bitcoin has reached 522 billion US dollars[4]. However, with the popularity of Bitcoin's "mining boom", soaring prices, a large number of speculators, and illegal activities, people are attracted by the innovative concept of Bitcoin, but they are also worried about the rapid and uncontrolled development of Bitcoin.
In view of the research on the risk characteristics of the bitcoin security crisis, Gandal and other scholars(2018) [5], exploited the data of 18 million user transactions leaked by the bitcoin exchange Mt.Gox from February to November 2013 to identify and analyze the suspicious transaction behavior of the exchange. The author found fraudulent transactions by analyzed two automated procedures - account Markus Bot and Willy Bot, which operated by the exchange itself. Markus bought 335.898 bitcoins in 33 days, but did not pay the corresponding real money. Willy Bot used 49 segregated accounts, each of which went dormant after buying $2.5 million worth of Bitcoin. Through the fraudulent trading practices, volume of the exchange platform was increased, and fees were also increased, made the exchange profitable. In addition, the traders can completely avoid such losses after identify risks of trading and trustworthy level of the other party’s account according to social network analysis.
With the rapid development of transactions, the regulatory issues brought about by Bitcoin have also attracted heavy attention from governments and central banks. Jafari(2019) [6], pointed out that when formulating laws, research on virtual currencies should be carried out in an all-round way to avoid the security risks caused by online currencies. Even under the protection of the law, Bitcoin crimes are commonplace. Foley(2019) [7], used network clustering measurement and detection control estimation to analyze user data on Bitcoin transactions from 2009 to 2017, approximately one-quarter of all users (26%) and close to one-half of bitcoin transactions (46%) are associated with illegal activity. Crime and deception account for a substantial proportion of Bitcoin trading while a network clustering algorithms can effectively identify user groups and transaction.
In conclusion, scholars' research on Bitcoin is mainly oriented to price fluctuations, trading patterns and for-risk regulations, father than having the role as a trader to analyze how to find a reliable trading partner. This article will analyze the trading trust mechanism by various quantitative methods combined with Rstudio software based on the user trust level database which provided by Bitcoin platform.
III. IMPLEMENTATION AND APPLICATION DEMONSTRATION
In this section, the application of social networks analysis will be utilized, as well as the interpretation of the results, which will be finally illuminated.
A. Social Network Graph
When constructing a social network based on the original data, a data frame was used to derive the dataset, source. Target nodes are represented as “trader 1, trader 2 and trust weighted of transaction” respectively in columns. The relationship between traders can be demonstrated by the following graph, nodes size can be proportional to the degree (transaction times) and indicate the importance of this node in network. Two nodes connected by edges without a specific direction, due to bitcoins transaction happened in a two-way street between them in an undirected graph. G1 is defined as trusted network whose weight is over 0, G2 is defined as untrusted network whose weight is less than 0.
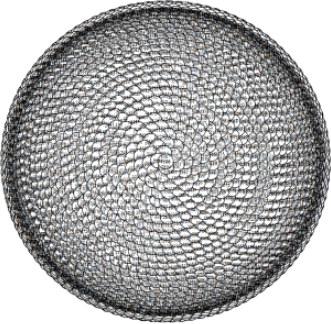
Figure 1. Social Network Graph of G1 (Sphere)
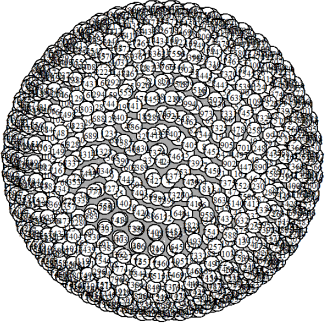
Figure 2. Social Network Graph of G2 (Sphere)
B. Structural Analysis
(1) Density
The density shows the ratio of actual connections (edges) present in the network to total possible connections. The graph density of g1 is 0.003340509, g2 is 0.004277027, and the overall density of figure g is 0.00338093, which belongs to a lower graph density. It indicates that the network is relatively sparse and has fewer connections compared to the total number of possible connections.
An important metric used in network analysis is the average path length, which quantifies the typical distance between pairs of nodes in a network. The average path length for g is 3.570839, which means that on average, it takes 3.570839 steps to reach any node in the network from any other node. And that for g1 is 3.657397, and for g2 is 4.02941. This relatively low average path length means that the network is well-connected, which facilitates efficient communication and information flow.
The transitivity of g is 0.07800737, for g1 is 0.0759961, and for g2 is 0.002294091, which displays that nodes in g are dislike to have a share common neighbors and the loosely structure of network is not strongly clustered.
Overall, according to the results above, according to the metrics provided, the network appears to have a low graph density, indicating that the network is sparse. However, the average path length of the network is relatively low, indicating good connectivity and efficiency in terms of communication and information flow. The network also exhibits low transitivity, indicating finite clustering or closure of triangles.
(2) Centrality Analysis
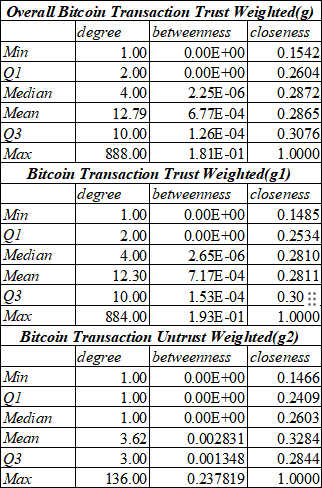
Table 1. Centrality Analysis of Bitcoin Transaction Trust Weighted
Freeman(1978) [8] defined degree centrality as the measurement which can quantifies the popularity of a node by counting the connected edges’ number within the network. In addition, the key nodes which control the information flow can be identified by calculating its betweenness centrality in a social network.
Firstly, the degree of nodes were sort decreasingly then it was found that user1 traded 888 times which was most frequently among all users, and user3’s transactions ranked the second which had 494 records. User1 also had the highest betweenness centrality of 0.19318, which indicated that user1 plays the most crucial role in the whole network. Moreover, user8 is the most important node in igraph g2 whose degree centrality is 136 and also has the highest betweenness centrality of 2.378186e-01. It is indicates that user8 is tent to be a dangerous user which may cause security threat during bitcoins dealing.

Figure 2. Correlations among Results
In order to gain more insight into the relationship between nodes’ connections and their roles’ meaning for other roles, the correlation between three kind of centrality is calculated: cor(Degree, Between) =0.8946, cor(Degree, Close)= 0.3953, cor(Close, Between)=0.2499. the results indicated that degree centrality and betweenness centrality has strong correlation. In another words, high degree central nodes having more chances to play the intermediaries and joint other parts in the network.

C. Units
· Use either SI (MKS) or CGS as primary units. (SI units are encouraged.) English units may be used as secondary units (in parentheses). An exception would be the use of English units as identifiers in trade, such as “3.5-inch disk drive”.
· Avoid combining SI and CGS units, such as current in amperes and magnetic field in oersteds. This often leads to confusion because equations do not balance dimensionally. If you must use mixed units, clearly state the units for each quantity that you use in an equation.
· Do not mix complete spellings and abbreviations of units: “Wb/m2” or “webers per square meter”, not “webers/m2”. Spell out units when they appear in text: “. . . a few henries”, not “. . . a few H”.
Identify applicable funding agency here. If none, delete this text box.
· Use a zero before decimal points: “0.25”, not “.25”. Use “cm3”, not “cc”. (bullet list)
D. Equations
The equations are an exception to the prescribed specifications of this template. You will need to determine whether or not your equation should be typed using either the Times New Roman or the Symbol font (please no other font). To create multileveled equations, it may be necessary to treat the equation as a graphic and insert it into the text after your paper is styled.
Number equations consecutively. Equation numbers, within parentheses, are to position flush right, as in (1), using a right tab stop. To make your equations more compact, you may use the solidus ( / ), the exp function, or appropriate exponents. Italicize Roman symbols for quantities and variables, but not Greek symbols. Use a long dash rather than a hyphen for a minus sign. Punctuate equations with commas or periods when they are part of a sentence, as in:
a + b = g (1)
Note that the equation is centered using a center tab stop. Be sure that the symbols in your equation have been defined before or immediately following the equation. Use “(1)”, not “Eq. (1)” or “equation (1)”, except at the beginning of a sentence: “Equation (1) is . . .”
E. Some Common Mistakes
· The word “data” is plural, not singular.
· The subscript for the permeability of vacuum m0, and other common scientific constants, is zero with subscript formatting, not a lowercase letter “o”.
· In American English, commas, semicolons, periods, question and exclamation marks are located within quotation marks only when a complete thought or name is cited, such as a title or full quotation. When quotation marks are used, instead of a bold or italic typeface, to highlight a word or phrase, punctuation should appear outside of the quotation marks. A parenthetical phrase or statement at the end of a sentence is punctuated outside of the closing parenthesis (like this). (A parenthetical sentence is punctuated within the parentheses.)
· A graph within a graph is an “inset”, not an “insert”. The word alternatively is preferred to the word “alternately” (unless you really mean something that alternates).
· Do not use the word “essentially” to mean “approximately” or “effectively”.
· In your paper title, if the words “that uses” can accurately replace the word “using”, capitalize the “u”; if not, keep using lower-cased.
· Be aware of the different meanings of the homophones “affect” and “effect”, “complement” and “compliment”, “discreet” and “discrete”, “principal” and “principle”.
· Do not confuse “imply” and “infer”.
· The prefix “non” is not a word; it should be joined to the word it modifies, usually without a hyphen.
· There is no period after the “et” in the Latin abbreviation “et al.”.
· The abbreviation “i.e.” means “that is”, and the abbreviation “e.g.” means “for example”.
An excellent style manual for science writers is [7].
IV. Using the Template
After the text edit has been completed, the paper is ready for the template. Duplicate the template file by using the Save As command, and use the naming convention prescribed by your conference for the name of your paper. In this newly created file, highlight all of the contents and import your prepared text file. You are now ready to style your paper; use the scroll down window on the left of the MS Word Formatting toolbar.
A. Authors and Affiliations
The template is designed for, but not limited to, six authors. A minimum of one author is required for all conference articles. Author names should be listed starting from left to right and then moving down to the next line. This is the author sequence that will be used in future citations and by indexing services. Names should not be listed in columns nor group by affiliation. Please keep your affiliations as succinct as possible (for example, do not differentiate among departments of the same organization).
1) For papers with more than six authors: Add author names horizontally, moving to a third row if needed for more than 8 authors.
2) For papers with less than six authors: To change the default, adjust the template as follows.
a) Selection: Highlight all author and affiliation lines.
b) Change number of columns: Select the Columns icon from the MS Word Standard toolbar and then select the correct number of columns from the selection palette.
c) Deletion: Delete the author and affiliation lines for the extra authors.
B. Identify the Headings
Headings, or heads, are organizational devices that guide the reader through your paper. There are two types: component heads and text heads.
Component heads identify the different components of your paper and are not topically subordinate to each other. Examples include Acknowledgments and References and, for these, the correct style to use is “Heading 5”. Use “figure caption” for your Figure captions, and “table head” for your table title. Run-in heads, such as “Abstract”, will require you to apply a style (in this case, italic) in addition to the style provided by the drop down menu to differentiate the head from the text.
Text heads organize the topics on a relational, hierarchical basis. For example, the paper title is the primary text head because all subsequent material relates and elaborates on this one topic. If there are two or more sub-topics, the next level head (uppercase Roman numerals) should be used and, conversely, if there are not at least two sub-topics, then no subheads should be introduced. Styles named “Heading 1”, “Heading 2”, “Heading 3”, and “Heading 4” are prescribed.
C. Figures and Tables
a) Positioning Figures and Tables: Place figures and tables at the top and bottom of columns. Avoid placing them in the middle of columns. Large figures and tables may span across both columns. Figure captions should be below the figures; table heads should appear above the tables. Insert figures and tables after they are cited in the text. Use the abbreviation “Fig. 1”, even at the beginning of a sentence.
TABLE I. Table Type Styles
|
Table Head |
Table Column Head |
||
|
Table column subhead |
Subhead |
Subhead |
|
|
copy |
More table copya |
|
|
a. Sample of a Table footnote. (Table footnote)
Fig. 1. Example of a figure caption. (figure caption)
Figure Labels: Use 8 point Times New Roman for Figure labels. Use words rather than symbols or abbreviations when writing Figure axis labels to avoid confusing the reader. As an example, write the quantity “Magnetization”, or “Magnetization, M”, not just “M”. If including units in the label, present them within parentheses. Do not label axes only with units. In the example, write “Magnetization (A/m)” or “Magnetization {A[m(1)]}”, not just “A/m”. Do not label axes with a ratio of quantities and units. For example, write “Temperature (K)”, not “Temperature/K”.
Acknowledgment (Heading 5)
The preferred spelling of the word “acknowledgment” in America is without an “e” after the “g”. Avoid the stilted expression “one of us (R. B. G.) thanks ...”. Instead, try “R. B. G. thanks...”. Put sponsor acknowledgments in the unnumbered footnote on the first page.
References
The template will number citations consecutively within brackets [1]. The sentence punctuation follows the bracket [2]. Refer simply to the reference number, as in [3]—do not use “Ref. [3]” or “reference [3]” except at the beginning of a sentence: “Reference [3] was the first ...”
Number footnotes separately in superscripts. Place the actual footnote at the bottom of the column in which it was cited. Do not put footnotes in the abstract or reference list. Use letters for table footnotes.
Unless there are six authors or more give all authors’ names; do not use “et al.”. Papers that have not been published, even if they have been submitted for publication, should be cited as “unpublished” [4]. Papers that have been accepted for publication should be cited as “in press” [5]. Capitalize only the first word in a paper title, except for proper nouns and element symbols.
For papers published in translation journals, please give the English citation first, followed by the original foreign-language citation [6].
[1] S. Kumar, F. Spezzano, V.S. Subrahmanian, C. Faloutsos. Edge Weight Prediction in Weighted Signed Networks. IEEE International Conference on Data Mining (ICDM), 2016.; S. Kumar, B. Hooi, D. Makhija, M. Kumar, V.S. Subrahmanian, C. Faloutsos. REV2: Fraudulent User Prediction in Rating Platforms. 11th ACM International Conference on Web Searchand Data Mining (WSDM), 2018.
[2] Nakamoto S. (2008) Bitcoin: A peer-to-peer electronic cash system.
[3] Nakamoto S. (2009) Chancellor Alistair Darling on brink of second bailout for Banks, The Times & The Sunday Times: breaking news & today’s latest headlines. Available at: https://www.thetimes.co.uk/article/chancellor-alistair-darling-on-brink-of-second-bailout-for-banks-n9l382mn62h
[4] Cryptocurrency prices, charts and market capitalizations (no date) CoinMarketCap. Available at: https://coinmarketcap.com/.
[5] Gandal,N.,Hamrick,J.T.,Moore,T.and Oberman,T.,201 8,Price Manipulation in the Bitcoin Ecosyste.Available at:https://www.sciencedirect.com/science/article/abs/pii/S0304393217301666
[6] Jafari, S., Vo-Huu, T., Jabiyev, B., Mera, A. and Mirzazade, R., 201 8,Cryptocurrency:A Challenge to Legal. Available at https://papers.ssrn.com/sol3/papers.cfm?abstract_id=3172489
[7] Foley, S., Karlsen, J. and Putnins, T. , 2019, Sex, Drugs, and Bitcoin:How Much Illegal Activity Is Financed Through Cryptocurrencies? SSRN Working Paper, No. 3102645. Available at: https://freepolicybriefs.org/wpcontent/uploads/2019/02/freepolicybrief_jan212019.pdf
[8] Freeman, L. C. (1978). Centrality in social networks: Conceptual clarification. Social Networks, 1(3), 215-239.]. Available at: https://www.sciencedirect.com/science/article/abs/pii/0378873378900217.
[9] M. Young, The Technical Writer’s Handbook. Mill Valley, CA: University Science, 1989.
IEEE conference templates contain guidance text for composing and formatting conference papers. Please ensure that all template text is removed from your conference paper prior to submission to the conference. Failure to remove template text from your paper may result in your paper not being published.
We suggest that you use a text box to insert a graphic (which is ideally a 300 dpi TIFF or EPS file, with all fonts embedded) because, in an MSW document, this method is somewhat more stable than directly inserting a picture.
To have non-visible rules on your frame, use the MSWord “Format” pull-down menu, select Text Box > Colors and Lines to choose No Fill and No Line.
2023-07-26