Problem Set 1, Econ 120C
Hello, dear friend, you can consult us at any time if you have any questions, add WeChat: daixieit
Problem Set 1, Econ 120C
Please follow the guidance below to submit all assignments:
(i) Please submit your answers, which can be either typed or handwritten on Canvas. If you type, use font size 11pt or 12pt.
(ii) Handwritten answers have to be scanned and saved in pdf (You can use your phone to take a picture and convert the picture into pdf. There are free app's that can scan a document into pdf directly). If you can specify the page size, choose the letter size (8.5 inch by 11 inch)
(iii) Please submit only one pdf file for each assignment. If you have multiple files, please combine them into one before submission.
(iv) For the questions that need Stata, please include your log and figures, if any. Please do not upload your log and figure files directly. Instead, convert them into pdf and include them in the pdf file you plan to submit.
(v) Again, please submit only one pdf file for each assignment. Please do not use any other file format. Please do not submit more than one file.
Part A. Multiple Choice (You do not need to provide any explanation. There is only one correct answer for each question)
1. Let
be iid with mean
. Consistency for the sample average
can be defined as follows, with the exception of
(a)
(b)
(c)

(d) the probability of
becomes arbitrarily close to one as n increases for any constant c > 0.
2. The OLS estimator is a random variable and
(a) is a single number and as a result cannot have a distribution.
(b) has a probability distribution called its sampling distribution.
(c) has a probability distribution called the standard normal distribution.
(d) has a probability distribution called normal distribution.
3. To infer the political tendencies of the students at your college/university, you sample 150 of them. Only one of the following is a simple random sample: You
(a) make sure that the proportion of minorities are the same in your sample as in the entire student body.
(b) call every fiftieth person in the student directory at 9 a.m. If the person does not answer the phone, you pick the next name listed, and so on.
(c) go to the main dining hall on campus and interview students randomly there.
(d) have your statistical package generate 150 random numbers in the range from 1 to the total number of students in your academic institution, and then choose the corre-sponding names in the student telephone directory.
4. Let
The central limit theorem states that
(a) the distribution for
(b)
(c) the probability that
(d)
is approximately normal when n is large.
5. The reason why estimators have a sampling distribution is that
(a) economics is not a precise science.
(b) individuals respond differently to incentives.
(c) in real life you typically get to sample many times.
(d) the values of the explanatory variable and the error term differ across samples
Part B: This year's graduating class at Uniform University contains exactly 900 seniors. Each senior has a random number of parents (0, 1, or 2) who will attend the graduation ceremony, and it happens that each of those three possibilities is equally likely, with probability 1/3 each, and the numbers of parents attending the ceremony for different seniors are independent random variables. The seating area for parents in the auditorium has 900 seats. Use a Normal approximation to approximate the probability that all of the parents who attend will be able to be seated. What if the seating area has 925 seats? What is the minimum number of seats that can ensure that with probability 0.95 all of the parents who attend will be able to be seated?
Part C: Let  and
and  be iid random variables with
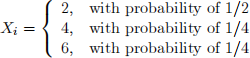
for i = 1 and 2:
1. What is the mean of
What is the standard deviation of
2. What is the mean of
What is its standard deviation?
3. What is the distribution of
? Graph the distributions of
equal to 2; 2; 4; and 6, respectively).
Part D: 1. Draw 500 random samples of size 8 from a random number generator from a standard normal distribution. Then increase the sample size to 32. Finally, increase the sample size to 128. Plot histograms of the sampling distributions of (i) the sample mean and (ii) the sample variance, for each of these three sample sizes. Now repeat your experiments for three samples drawn from another parametric distribution of your choice (e.g., a uniform distribution). Discuss the results of your experiments in light of the central limit theorem.
2. Your experiments produce "samples of sample means." Compute the mean and variance of the sample means generated by each experiment and compare them to the mean and variance predicted by statistical theory. Does the variance of the sample means (i.e., the sampling variance) decrease with the sample size at the rate predicted by the theory? Does Normality matter for this?
Part E: Read the following Stata program
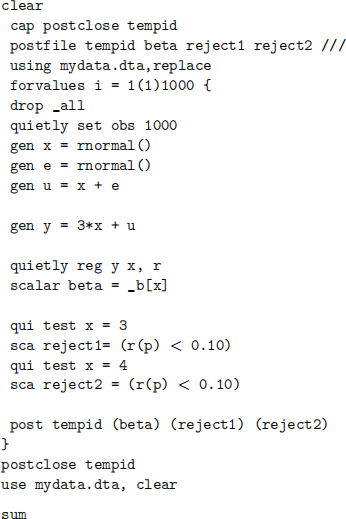
Part of the output is given in the table below:
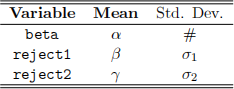
Answer the following questions with detailed arguments.
(a) What would you expect the value of
to be?
(b) What would you expect the value of
to be?
(c) What would you expect the value of
to be?
(d) What would you expect the value of
to be?
(e) What would you expect the value of
to be?
Part F: Let  where
where  are independent standard normals. We have iid observations
  from this model.
(a) Suppose we run the following regression

to obtain the OLS estimator  . What would you expect the value of to be when
  Please give a numerical answer.
(b) Suppose we run the following regression
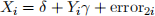
to obtain the OLS estimator  . What would you expect the value of to be when Please give a numerical answer.
2021-08-21