Michaelis-Menten Model - CHEM 233L - Spring 2023
Hello, dear friend, you can consult us at any time if you have any questions, add WeChat: daixieit
Michaelis-Menten Model - CHEM 233L - Spring 2023
Enzymes are proteins that catalyze chemical reactions occurring in living
organisms. They are characterized by a high degree of substrate specificity, by having great catalytic capacity, and by the fact that their activities can be
regulated in a number of different ways. Enzymes enhance reaction rates by reducing the activation energies of the reactions they catalyze; they do not alter reaction equilibria.
Quantitative determinations of enzyme activity are essential for an
appreciation of their biological functions and also for the measurement of
actual enzyme concentration in tissue samples. Enzyme activities are
influenced by such factors as substrate concentration, pH, temperature, ionic strength, and the presence of activators or inhibitors.
The Michaelis-Menten model for enzyme substrate interaction is based on the assumption that only substrate present in the system, but not product formed, affects enzyme activity, so that in essence the reaction is proceeding in one direction only. According to this model, the enzyme (E) combines with the
substrate (S) to form an enzyme-substrate (ES) complex which subsequently reacts to form product (P) and free enzyme (E).

This simplified model of enzyme behaviour accounts for the kinetic properties of a number of enzymes and is expressed as the Michaelis-Menten rate equation:
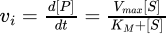
Where vi = initial velocity and [S] = substrate concentration
Accordingly, the rate of an enzyme catalyzed reaction is dependent on [S]. The response of such enzyme to changes in [S] can be described in terms:
1. Vmax (pronounced Vee max), the maximum velocity that the enzyme would exhibit if fully saturated with substrate; and
2. KM, the Michaelis constant. KM is a measure of the enzyme’s affinity for its substrate and is quant itated by measuring the substrate concentration required to reach one-half of the maximum velocity.
Measuring enzymatic rate as a function of substrate concentration will often
produce a square hyperbolic curve that follows the Michaelis-Menten equation. A Michaelis-Menten plot is illustrated below.
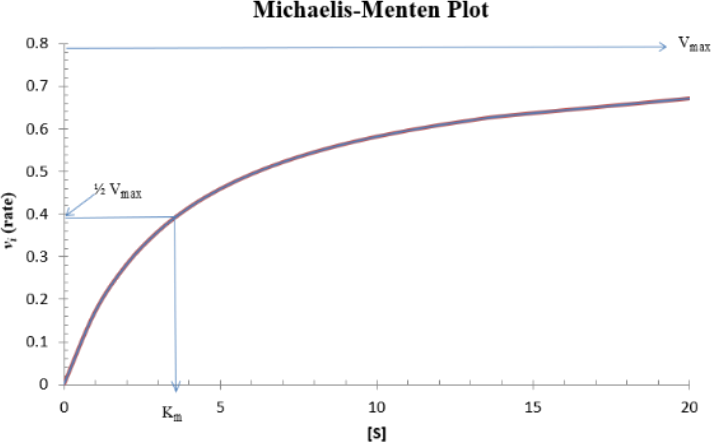
The definition of KM as the substrate concentration required to give a rate (vi) = Vmax/2, provides a useful qualitative index for an enzyme's actual biological performance. Since a high value for KM indicates low enzyme affinity for
substrate and vice versa, it follows that the degree to which potential catalytic capacity is utilized depends on the actual cellular substrate concentration in relation to the KM value of the enzyme. It is of interest to note that many
cellular enzymes have KM values which are close to the physiological
concentrations of their substrate. In this way, they are able to achieve a
desirable compromise between catalytic efficiency on one hand, and capacity for self-regulation on the other.
Transformation of the Michaelis-Menten equation into one that is linear facilitates the determination of the Michaelis-Menten parameters. A
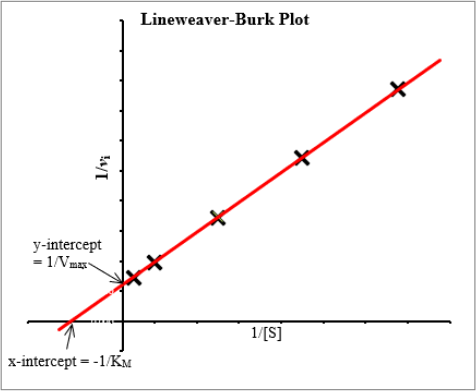
Lineweaver-Burk plot (also known as a double reciprocal plot) is a linear
equation produced from taking the inverse of the Michaelis-Menten equation.
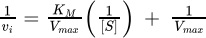
Data from enzymatic studies can be fitted into a Lineweaver-Burk plot by simply plotting the inverse of the initial enzymatic rate (1/vi – on the yaxis) against the inverse of substrate concentration (1/[S] – on the xaxis). A linear regression of the data points will produce a line from which we can easily determine the Michaelis-Menten parameters. Accordingly, KM can be determined by calculating the negative inverse of the x-intercept and Vmax from the inverse of the y-intercept. See the plot below.
For the Michaelis-Menten model, the catalytic constant or turnover
number, kcat, is the number of reaction processes that each active site catalyzes per unit time and is defined as:

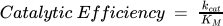
The catalytic efficiency is an additional characteristic that is considered when monitoring enzymatic behaviour. It considers both the turnover rate as well as the enzyme’s affinity for its substrate.
|
Test Your Understanding 1. Vmax is dependent on … A. the concentration of enzyme B. the affinity of the enzyme toward the substrate C. the concentration of substrate 2. Which axes units are appropriate for the Michaelis-Menten plot? A. abs (y- axis) vs µM (x- axis) B. min (y- axis) vs µM (x- axis) C. µM (y- axis) vs µM/min (x- axis) D. µM/min (y- axis) vs µM (x- axis) 3. Which axes units are appropriate for the Lineweaver-Burk plot? A. µM/min (y- axis) vs µM- 1 (x- axis) B. min/µM (y- axis) vs µM- 1 (x- axis) C. µM/min (y- axis) vs µM (x- axis) D. min/µM (y- axis) vs µM (x- axis) |
|
(Answers: 1 A. , 2 D. , 3 B.) |
2023-07-21