Energy Skate Park APP1 Lab #1
Hello, dear friend, you can consult us at any time if you have any questions, add WeChat: daixieit
Energy Skate Park
APP1 Lab #1
Version 1.1
Before you begin the lab:
✔ Open the Energy Skate Park PhET simulation on your device.
( https://phet.colorado.edu/en/simulation/energy-skate-park-basics)
✔ Stopwatch (hopefully your phone or watch has one)
Purpose
You are investigating the relationship between kinetic energy, potential energy, and total energy when only conservative forces are present and then again when non-conservative forces are present. The data will be analyzed graphically in order to provide a clear trend.
Directions
Part 1- Conservative Forces
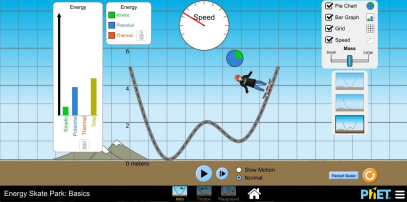
1. Open Energy Skate Park. Choose Intro.
2. Take time to play around with the simulation. Make sure all boxes are checked.
● What do you notice about the total energy, kinetic energy, and potential energy in the bar graph?
● What do you notice about the pie graph? What must you do in order to get the pie graph to be larger?
3. You are measuring the changes in energy- total, kinetic, and potential over time. To do this, we need to define our system. This is a skater-earth system.
4. We also need to establish numbers for mass and speed.

5. Choose “Slow Motion.” Place the 20-kg skater at 6-m and start the timer when you hit play. Pause both timer and sim when the skater is at 6-m, 4-m, 2-m, 0-m, . Record the height, speed, and time in the table below.
|
Time (s) |
Height (m) |
Velocity (m/s) |
|
0-s |
6-m, left |
0-m/s |
|
|
4 m, left |
|
|
|
2 m, left |
|
|
|
0 meters |
|
|
|
2 m, right |
|
|
|
4 m, right |
|
|
|
6 m, right |
|
6. Calculate the potential energy, kinetic energy, and total energy of the system using the data from #4.
Be sure to use 9.81 m/s2 for g.
|
Time (s) |
Potential Energy (J) |
Kinetic Energy (J) |
Total Energy (Mechanical energy) |
Sum up your findings. Include data in your response.
Part 2- Non-conservative Forces
7. Click “Friction” at the bottom of the simulation.
8. Take time to play around with this simulation. Make sure all boxes are checked.
● What do you notice about the total energy, kinetic energy, and potential energy in the bar graph?
● What do you notice about the final thermal energy & the total energy once the skater has stopped?
9. You are measuring the changes in energy- total, kinetic, and potential over time. To do this, we need to establish numbers for mass and speed as well as our system: This is a skater-earth system.
10. Choose “Slow Motion.” Place the 20-kg skater at 6-m and start the timer when you hit play. Pause both timer and sim when the skater is at 6-m, 4-m, 2-m, and 0-m. Record the height, speed, and time in the table below. You probably won’t make the height of 6-m on the right so just continue to the next location.
|
Time (s) |
Height (m) |
Velocity (m/s) |
|
0-s |
6-m |
0-m/s |
11. Calculate the potential energy, kinetic energy, and total energy of the system using the data from #10.
Be sure to use 9.81m/s2 for g.
|
Time (s) |
Potential Energy J) |
Kinetic Energy (J) |
Thermal Energy (J) |
Total Energy (J) |
Summarize this part of the lab dealing with friction and thermal heat. Use data for verification.
Power: The purpose of this lab is to see the difference between work and power when you are going slowly and quickly up a flight of stairs.
Find a set of stairs (can be a flight or just a couple going to a porch) and find the work and power it takes for you to walk slowly and quickly up the stairs. You will need a ruler and stopwatch for this part of the lab. Write down the procedure and data you took in order to find the work and power of you going up the stairs.
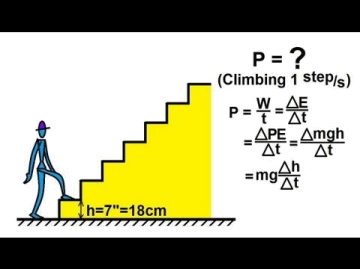
Your data should include the force moving up the stairs, the height traveled and the time for each trial. Calculations should include work and power for both trials (slow and fast)
Analysis; what were your results and the effects on work and power.
2023-07-15