ECOM055 – Risk Management For Banking – 2022/23 Sem C Problem Set 1
Hello, dear friend, you can consult us at any time if you have any questions, add WeChat: daixieit
ECOM055 – Risk Management For Banking – 2022/23 Sem C
Problem Set 1
Based on Book Chapters 1
L-questions are questions about the lecture and extra materials, H(ull)-questions are question from the book.
L1.1 Explain how risk management could increase the stock market value of financial institutions.
Remind that equity value is the levered free cash flows (cash flow available to equity shareholders) discounted by the cost of equity. Bankruptcy is costly and reduces free cash flows to equity holders. If risk management could reduce bankruptcy costs, it will have a positive effect on the equity value of financial institutions today.
L1.2. Consider the following news article titles. Do the articles discuss credit risk, market risk, operational risk, or liquidity risk? Use the definitions from the lecture and explain your answer.
Article 1:“Interbank dollar lending markets remain stressed”
Article 2:“Special Report: How a rogue trader crashed UBS”
Article 3:“U.S. banks' commodity trading exposures rise on Russia conflict”
Definitions:
Market risk: The risk of losses arising from movements in market prices.
Credit risk: The potential that a bank borrower or counterparty will fail to meet its obligations in accordance with agreed terms.
Operational risk: The risk of loss resulting from inadequate or failed internal processes, people and systems or from external events.
Funding liquidity risk: the ability of a bank to fund increases in assets and meet obligations as they come due, without incurring unacceptable losses.
Article 1: Liquidity risk. Why: “banks continued to struggle to raise short-term funds” .
Article 2: Operational Risk: “discuss the loss of $2.3 billion by an alleged rogue trader in its London-based investment banking arm.” (failed internal processes / people).
Article 3: Market risk. Why: “Wall Street banks' commodities trading exposures are rising, which could leave them vulnerable to large swings in asset values following Russia's invasion of Ukraine, first quarter earnings disclosures showed.” (risk of losses arising from movements in market prices)
L1.2. Calculate the minimum capital the bank below is required to hold based on its exposures. Assume a Cooke Ratio of 8 percent.
Asset EAD RW RWA
|
UK treasury bonds |
50 |
0% |
|
Residential mortgage |
100 |
50% |
|
Corporate loans |
250 |
100% |
|
Revolving credit |
80 |
100% |
Total
Asset EAD RW RWA
|
UK treasury bonds |
50 |
0% |
0 |
|
Residential mortgage |
100 |
50% |
50 |
|
Corporate loans |
250 |
100% |
250 |
|
Revolving credit |
80 |
100% |
80 |
Total 380
Cooke ratio 8% 30.4
L2. 1
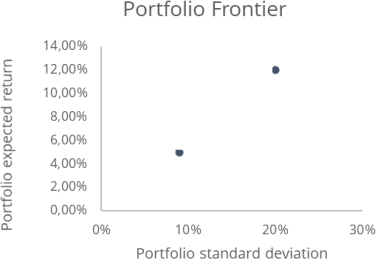
Consider the CAPM model for assets of 2 countries home(1) and foreign(2):
E(R1) = 5,00% σ(R1) = 9%
E(R2) = 12,00% σ(R2) = 20%
ρ(R1,R2) = -0,20
E(R1) and E(R2) are the expected returns of the home and foreign market. σ(R1) and σ(R1) the standard deviation of the returns, and ρ(R1,R2) the correlation between the home and foreign asset.
Draw a figure with the risk (standard deviation) on the x-axis and the portfolio return on the y-axis. Add the portfolios containing 100% the home asset and 100% the foreign asset. For this question do not have to calculate anything. (easy)
L2.2
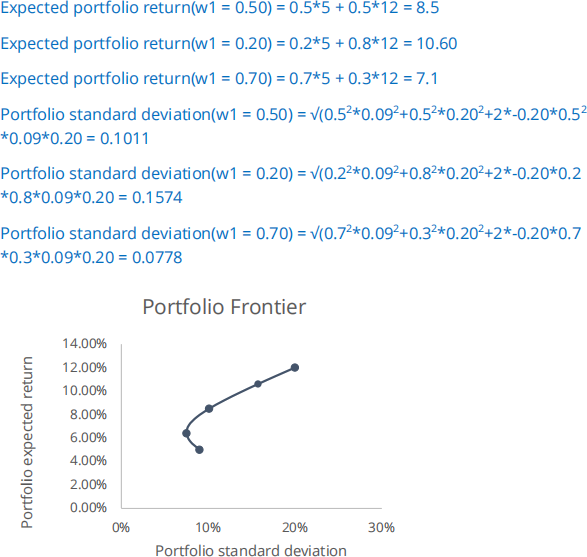
What is the portfolio risk and return if the investor invests 50 percent of his money in the home asset? Use the formulas below. Once you have the answer put the 50% portfolio on the graph. Repeat this exercise for 20 percent and 70 percent home asset weight portfolios. Draw the portfolio frontier (medium)
Expected portfolio return: 
Portfolio variance: 
Note: the portfolio standard deviation 
L2.3
Draw a figure with the risk (standard deviation) on the x-axis and the portfolio return on the y-axis in Python. Create 11 portfolios (e.g. w1 = 0, 0.1, … ., 0.9, 1). Use the code from the lecture. Draw the portfolio frontier for rho = - 1, 0, -2.
Answer
#Step 1: Import packages
import matplotlib.pyplot as plt
import numpy as np
import pandas as pd
#Step 2: Inputs
r_h = 0.05 #expected return home asset
r_f = 0.12 #expected return foreign asset
sd_h = 0.9 #standard deviation home asset
sd_f = 0.20 #standard deviation foreign asset
rho_hf = -0.20 #correlation coefficient home - foreign asset
#Step 3: Define functions
def portfolio_ret(w1): # A function is a block of code which only runs when it is called.
ret = w1*r_h + (1-w1) * r_f #Portfolio volatility formula
return ret
def portfolio_sd(w1):
sd = np.sqrt(w1**2 * sd_h**2 + (1-w1)**2 * sd_f**2 + 2 * rho_hf * w1 * (1-w1) * sd_f * sd_h) #Portfolio volatility formula
return sd
#Step 4: Create portfolios with different weights
p_ret = [] # Define an empty array for portfolio returns
p_vol = [] # Define an empty array for portfolio volatility
p_weights = [] # Define an empty array for asset weights
for i in np.linspace(0,1,11): #A for loop is used for iterating over a sequence # np.linspace: Return evenly spaced numbers over a specified interval.
p_ret.append(portfolio_ret(i))
p_vol.append(portfolio_sd(i))
p_weights.append(i)
p_data = {'Returns':p_ret, 'Volatility':p_vol, 'Weight':p_weights} #Dictionaries are used to store data values in key:value pairs
portfolios = pd.DataFrame(p_data) #A Pandas DataFrame is a 2 dimensional data structure, like a 2
dimensional array, or a table with rows and columns
print(portfolios)
#Step 5: Plot the portfolios
portfolios.plot.scatter(x='Volatility', y='Returns', marker='o', grid=True)
L2.4 Use ChatGPT to explain the following code parts:
Code:
def portfolio_sd(w1):
sd = np.sqrt(w1**2 * sd_h**2 + (1-w1)**2 * sd_f**2 + 2 * rho_hf * w1 * (1-w1) * sd_f * sd_h) return sd
ChatGPT prompt:
Explain the following python code line by line:
def portfolio_sd(w1): sd = np.sqrt(w1**2 * sd_h**2 + (1-w1)**2 * sd_f**2 + 2 * rho_hf * w1 * (1-w1) * sd_f * sd_h)
return sd
Answer
Sure! Here's a line-by-line explanation of the provided Python code:
python
def portfolio_sd (w1):
This line defines a function named portfolio_sd that takes a single parameter w1.
python
sd = np.sqrt(w1**2 * sd_h**2 + (1-w1)**2 * sd_f**2 + 2 * rho_hf * w1 * (1-w1) * sd_f * sd_h)
This line calculates the portfolio volatility using the provided formula. The variables sd_h, sd_f, and rho_hf are assumed to be previously defined. The formula is a mathematical expression that computes the standard deviation (volatility) of a portfolio based on the given weights w1, standard deviations sd_h and sd_f, and the correlation coefficient rho_hf.
python
return sd
This line returns the calculated portfolio volatility sd as the result of the function.
In summary, the code defines a function called portfolio_sd that takes a parameter w1 and calculates the volatility of a portfolio using the provided formula. The function then returns the calculated volatility.
2023-07-13