906 Groupwork Project
Hello, dear friend, you can consult us at any time if you have any questions, add WeChat: daixieit
906 Groupwork Project
Introduction:
By using the Box-Jenkins approach, we focus on the finding the best fit model for the time series of the stock market in Australia, United State and China respectively.
Data description:
we choose the choose the S&P/ASX 300 index, S&P 500 and CSI300 as the representatives of the stock market in Australia, United State and China respectively, and we collect the actual daily data in 2016.
Model:
In Australia stock market:
Empirical Findings for the Australian stock market:
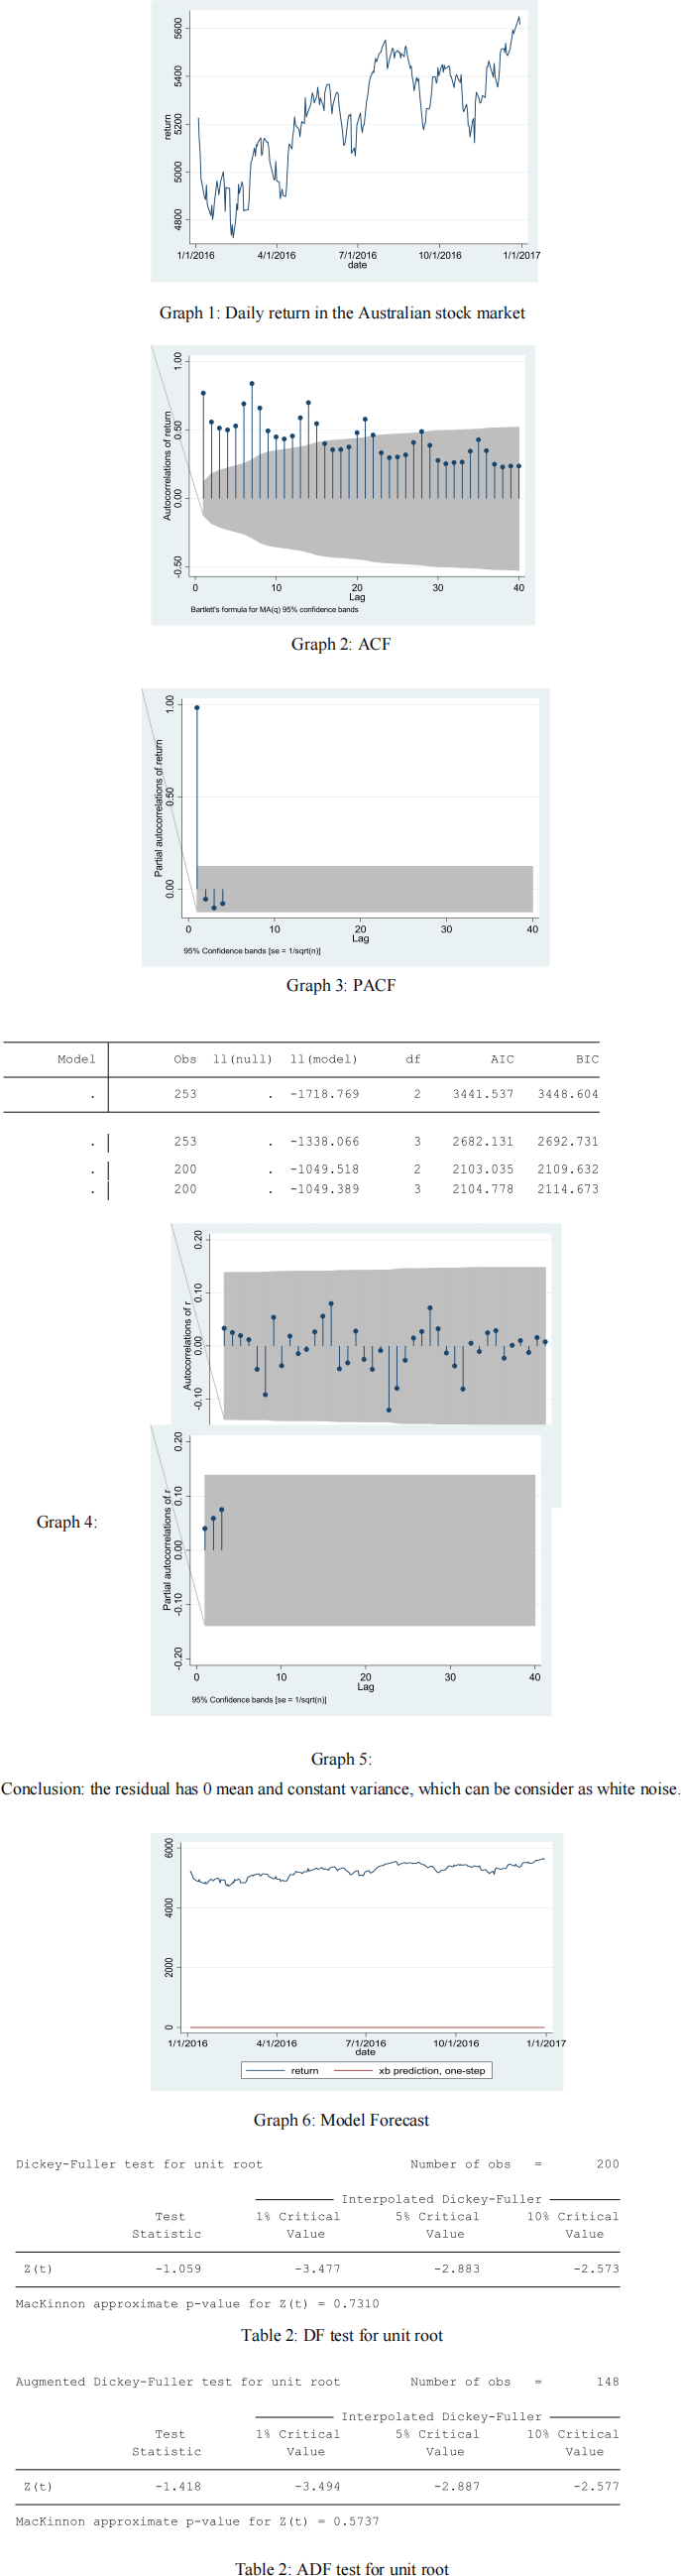
![]() From graph 1, we can infer that the stock returns may have a trend.
From graph 1, we can infer that the stock returns may have a trend.
![]() From graph 2, ACF: exponentially decay and the sample autocorrelations show that there
From graph 2, ACF: exponentially decay and the sample autocorrelations show that there
is large even at long lags, so it is a nonstationary time series.
![]() From graph 3, PACF: it exhibits a single statistically significant spike at lag 1, while all
From graph 3, PACF: it exhibits a single statistically significant spike at lag 1, while all
other coefficients are within the confidence bands and thus insignificant. This essentially means that the remaining higher order autocorrelations are well explained by the lag 1 autocorrelation.
![]() Conclusion: it could be an AR ( 1) model with no moving average.
Conclusion: it could be an AR ( 1) model with no moving average.
![]() By comparing ARIMA (0,0,0), ( 1,0,0), (0, 1,0) and (1, 1,0) respectively with AIC and BIC
By comparing ARIMA (0,0,0), ( 1,0,0), (0, 1,0) and (1, 1,0) respectively with AIC and BIC
from table 1, ARIMA (0, 1,0) is the best model.
![]() From graph 6, although the model satisfies all the conditions it needs to be a univariate
From graph 6, although the model satisfies all the conditions it needs to be a univariate
model, it has no forecasting power as it is a simple random walk model without constant.
![]() From Table 2 and table 3, we can conclude that there is no unit root in the AU stock
From Table 2 and table 3, we can conclude that there is no unit root in the AU stock
market.
In US stock market:
Empirical Findings for the American stock market:
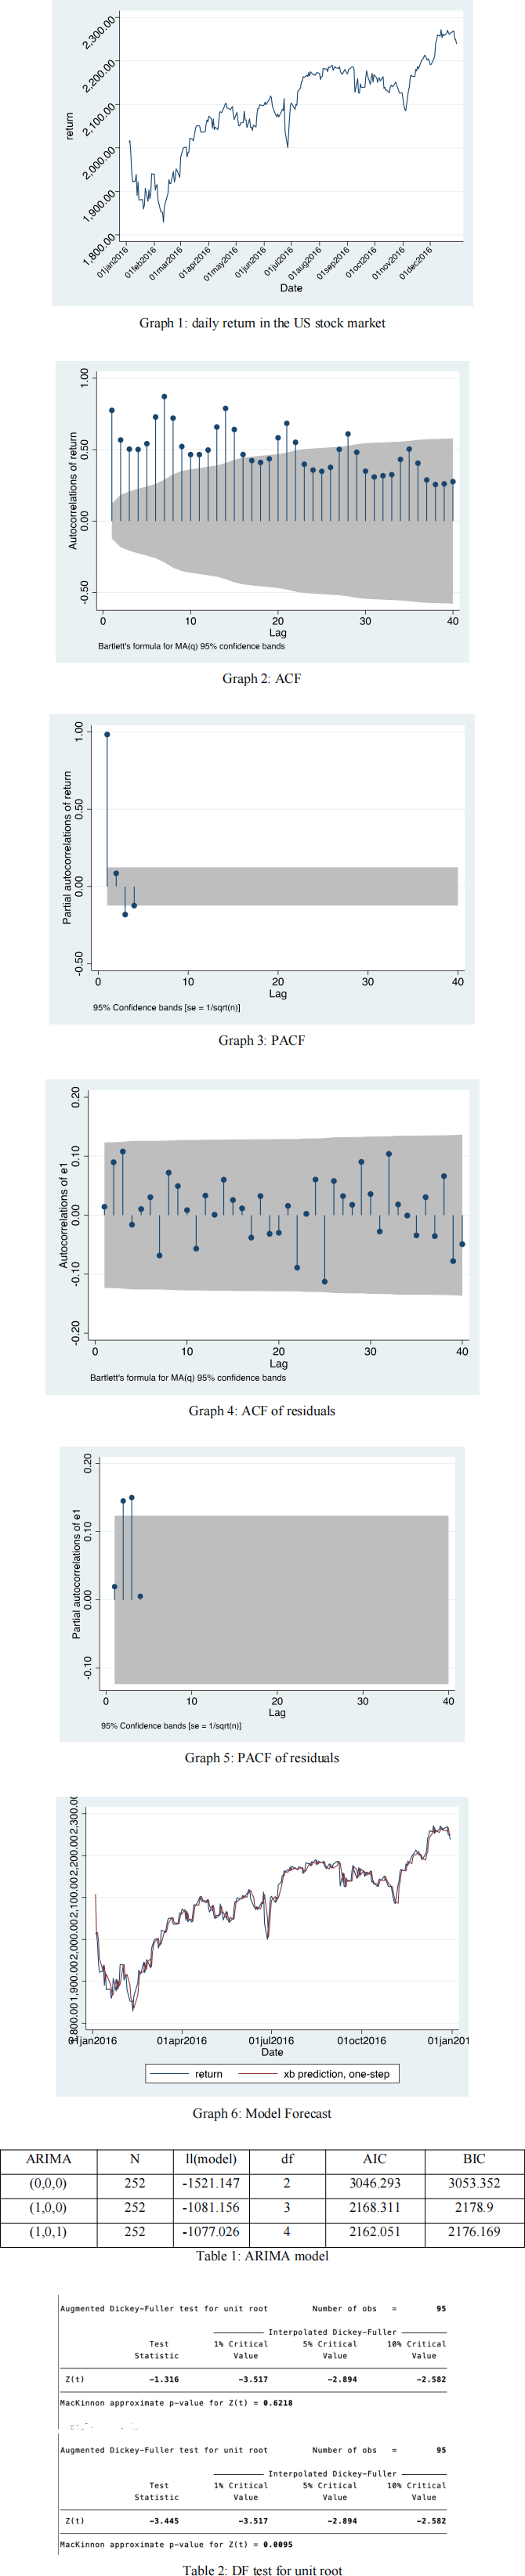
![]() From graph 2, the data probably have a trend component and a seasonal component.
From graph 2, the data probably have a trend component and a seasonal component.
From graph 3, PACF: it exhibits a single statistically significant spike at lag 1, while all
other coefficients are within the confidence bands and thus insignificant. This essentially means that the remaining higher order autocorrelations are well explained by the lag 1 autocorrelation.
![]() Conclusion: it could be an AR ( 1) model with no moving average.
Conclusion: it could be an AR ( 1) model with no moving average.
![]() By comparing ARIMA (0,0,0), ( 1,0,0), and ( 1,0, 1) respectively with AIC and BIC from
By comparing ARIMA (0,0,0), ( 1,0,0), and ( 1,0, 1) respectively with AIC and BIC from
table 1, ARIMA ( 1,0, 1) is the best model.
![]() From graph 6, although the model satisfies all the conditions it needs to be a univariate
From graph 6, although the model satisfies all the conditions it needs to be a univariate
model, it has no forecasting power as it is a simple random walk model without constant.
![]() From Table 1, we can conclude that there is no unit root in the US stock market at 1%
From Table 1, we can conclude that there is no unit root in the US stock market at 1%
significance level.
In China stock market
Empirical finding for the Chinese stock market:
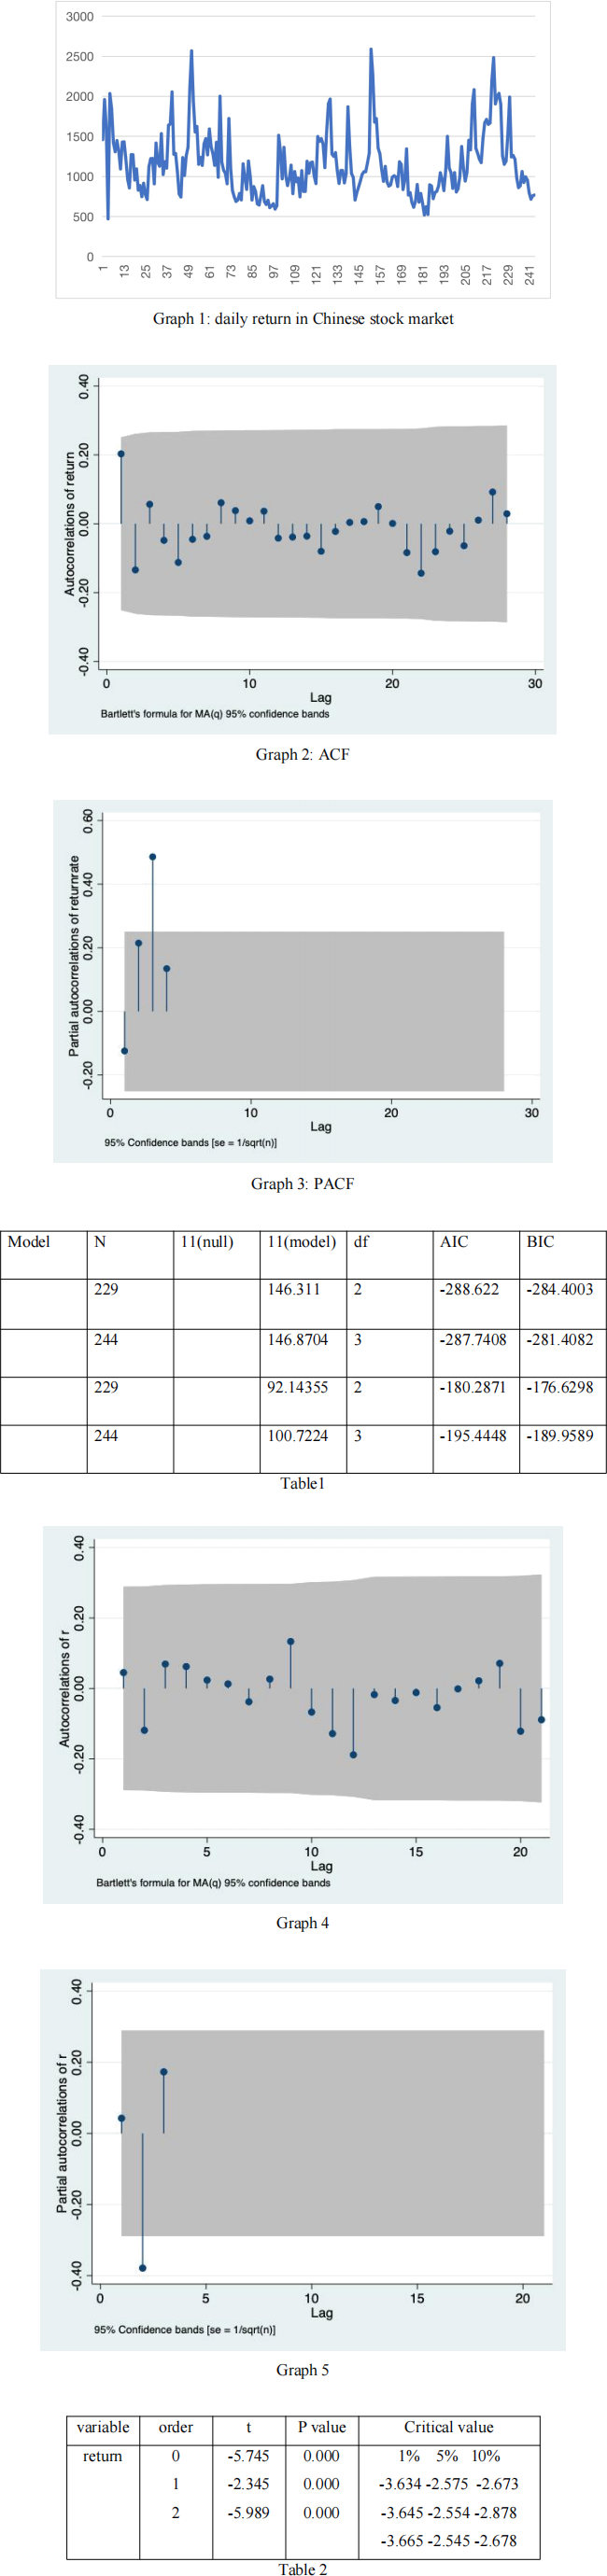
![]() From the graph 1, it illustrates that in China stock market has some bubbles, after that, the
From the graph 1, it illustrates that in China stock market has some bubbles, after that, the
stock market has the trend
![]() ACF: the autocorrelation implies that it may be large even at long lags, at the difference
ACF: the autocorrelation implies that it may be large even at long lags, at the difference
of 0 order, the significance p-value is 0.000, and it is very significant, so we can reject the null hypothesis, and it is a non- stationary time series.
![]() PACF: The partial autocorrelation graph is shown that upper and lower confidence limits,
PACF: The partial autocorrelation graph is shown that upper and lower confidence limits,
it only represents the statistically significant in lag ( 10).
![]() Comparing ARIMA (0,0,0), ( 1,0,0)(0, 1,0)(1, 1,0)with AIC and BIC from
Comparing ARIMA (0,0,0), ( 1,0,0)(0, 1,0)(1, 1,0)with AIC and BIC from
table1.ARIMA(0, 1,0)is the best model.
![]() From graph4 and 5, the residual has 0 mean and constant variance, and it can be white
From graph4 and 5, the residual has 0 mean and constant variance, and it can be white
noise.
![]() The ADF result is on the table 2.The result show that p-value is 0.000,it means that
The ADF result is on the table 2.The result show that p-value is 0.000,it means that
significant, so we will reject the null hypothesis, it is a non-stationary time series , and has no unit root in China stock market.
Conclusion:
By using the Box-Jenkins approach to analyze the three stock market,we found that Britain's departure from Europe has no effect on atuogression and changes on these stock market.The model ARIMA( 1,0, 1)means that it has nothing to d0 with the market,and it in a random walk progress.The real policy changes on countries will have effected on their stock market.
Reference:
S&P500:
https://au.finance.yahoo.com/quote/%5EGSPC/history?period1=1420070400&period2=1577750 400&interval=1d&filter=history&frequency= 1d&includeAdjustedClose=true
S&P/ASX300:
https://au.finance.yahoo.com/quote/%5EAXKO/history?period1=1420070400&period2=157775 0400&interval=1d&filter=history&frequency= 1d&includeAdjustedClose=true
CSI 300 index:
https://www.csindex.com.cn/#/indices/family/detail?indexCode=000300
STATA code
***AU stock market
import excel "\\Client\C$\Users\75874\Desktop\au 2016.xlsx", sheet("Sheet 1") firstrow tsset date
ac return
pac return
corrgram return
*ic
varsoc return
arima return, arima(0,0,0) nolog
estat ic
arima return, arima( 1,0,0) nolog
estat ic
estat ic
arima return, arima( 1, 1,0) nolog
estat ic
*Validation
predict r,residual
sum r
corrgram r
ac r
pac r
*Forecast
arima return, arima(0, 1,0) nolog
predict forecast,xb
tsline return forecast
***US stock market
import excel "/Users/si/Desktop/2016stock.xlsx", sheet("Sheet 1") firstrow
tsset Date
tsline return
corrgram return
ac return
pac return
predict r, residuals
predict y
corrgram r, lag( 10)
ac r
pac r
arima return, arima( 0,0,0)
estat ic
arima return, arima( 1,0,0)
estat ic
arima return, arima( 1,0, 1)
estat ic
arima return, arima(2,0,0)
estat ic
arima return, arima(2,0, 1)
estat ic
arima return, arima(2,0,2)
estat ic
arima return, ar( 1/2) nolog
predict forecast, xb
tsline return forecast
***CHN stock market
tsset date
tsline returnrate
corrgram returnrate
ac returnrate
pac returnrate
varsoc returnrate
arima returnrate,arima(0,0,0)nolog
estat ic
arima returnrate,arima( 1,0,0)nolog
estat ic
arima returnrate,arima(0, 1,0)nolog
estat ic
arima returnrate,arima( 1, 1,0)nolog
estat ic
predict r,residual
sum r
corrgram r
ac r
pac r
arima returnrate, arima (0, 1,0)nolog
predict forecast,xb
tsline returnrate forecast
2023-07-12