Kaplan Biosciences Laboratory Practical I
Hello, dear friend, you can consult us at any time if you have any questions, add WeChat: daixieit
Kaplan Biosciences Laboratory Practical I (22nd MAY, 2023)
Aim: In this laboratory session you will carry out an experiment to investigate the effect of temperature on the integrity of biological membranes including some basis statistical analysis involving the calculation of mean values and the corresponding standard deviation values as well as plotting a scatter graph.
Health and Safety: The are no particular hazards associated with this practical class but you need to follow the instructions of the member(s) of staff running the class who will brief you on both what you need to do and on any potential hazards involved.
General Instructions
For this practical you will be working in groups of THREE.
Make sure you carefully and neatly record any additions and amendments to the protocol and carefully record all data collected in your lab. book or notebook.
Effect of temperature on membrane permeability
Background
This laboratory session brings together a simple study of membrane function and the development of the principles of scientific method – i.e., hypothesis formulation and data gathering and analysis.
Biological membranes are composed of a phospholipid bilayer in which the hydrophilic head of the phospholipid molecules are orientated so that they face the internal and exterior aqueous environments, while the centre of the membrane contains the hydrophobic fatty acids side-chains arranged “tail to tail” (see below).
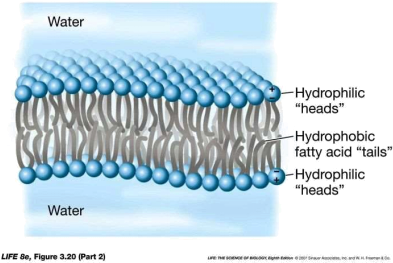
As a result of this arrangement, the centre of the membrane in hydrophobic and so prevents the free movements hydrophilic molecules.
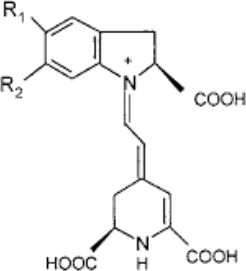
In plant cells the vacuoles are the normal storage sites for pigments, nutrients, salts, etc. and are part of the cell’s endomembrane system. Using techniques to disturb the integrity of the membrane can alter the permeability of these membranes allowing pigment – such as betacyanin (see below), which is the red pigment found in beetroot – to leak out of the cells.
In this practical, you will perform an experiment to determine the effect (if any) of increasing temperature on the permeability of membranes of beetroot cells.
Before you begin clearly state your hypothesis with regard to your predicted effect of increasing temperature on membrane integrity.
The effect of heat treatment will be measured by determining how much betacyanin pigment leaks out of the beetroot tissue compared to the control sample, using a spectrophotometer. The control sample will be the untreated beetroot at room temperature so make sure to record this value using the thermometer provided!
Switch on the spectrophotometer at the beginning of the experiment to allow it to stabilise electronically and thermally. After a few minutes, after it has gone through its self-calibration routine, make sure that ‘Absorbance’ is selected and then set the wavelength to 525 nm.
Method
1. Using a cork borer, cut sufficient (use a scalpel or razor blade)
number of cylinders of beetroot, which when cut will give 18 x 1.0 cm length uniform sections. If you have the larger diameter cork borer, use 0.75 cm length sections (i.e. 18 x 0.75 cm).
2. Transfer all the cut cylinders to a small beaker and half fill with
water and leave for a few minutes to rinse the free pigment from the cut surfaces of the pieces of beetroot.
3. Repeat the rinsing process once more. Do not leave the cylinders to
soak in the water!
4. Using a glass pipette and filler prepare 18 test tubes by adding 5 ml
of distilled water to each of the test tubes.
5. You will be using three small tubes for each heat-treated sample,
that is 70°C, 60°C, 50°C, 40°C, 30°C and room temperature, so label the tubes accordingly (i.e. three tubes labelled “70°C”, three labelled “60°C”, etc.)
6. Make sure you make a note of the room temperature using the
thermometer.
7. Half-fill the large glass beaker provided with water and using the
Bunsen burner heat the water to just over 70 °C, then turn off the heat source and carefully place the beaker on the on the bench. You should ask one of the lecturers or demonstrators to move the beaker from the Bunsen burner to the bench.
8. When the temperature falls to 70 °C, each member of the group
should hold a beetroot cylinder, using forceps, in the water for exactly 1 minute. Then transfer each beetroot cylinder to one of the individual test tubes containing 5.0 ml of distilled water, recording the time the beetroot cylinders were added to the tubes, and then incubate for 20 minutes, discarding the beetroot after this time, BUT keeping the solution in the tube!
9. Monitor the water temperature in the large beaker as the water cools, and when it reaches 60 °C, repeat step 8 with three fresh beetroot cylinders.
10. Treat additional cylinders at 50 °C and 40 °C and 30 °C as described in steps 8 and 9 above.
11. Prepare a room temperature control, by using three non-heat treated beetroot cylinders and placing each of these in tubes with 5.0 mL water for 20 mins. Using the thermometer, measure room temperature and record this data for inclusion in your table.
12. Incubate all the tubes on the bench in their appropriate tube containing 5 mL of distilled water for 20 minutes – occasionally gently flicking the tubes to mix the contents but be careful not to damage the beetroot cores.
13. Make sure for the cylinders treated at each temperature, that they are then incubated at room temperature in the 5 mL of distilled water for 20 mins only.
14. Confirm that the spectrophotometer is set to 525 nm.
Three-quarters fill a 1 cm plastic cuvette using a Pasteur pipette by transferring some of the water from one of the room temperature control samples to the cuvette to “blank” the spectrophotometer and set to zero. Record your absorbance in Table 1 below.
*Do NOT use water as the blank, the “blank” should be one of your room temperature control samples*.
15. In turn, using the same cuvette, transfer liquid from each tube and measure and record the absorbance reading in the Table below. This should be repeated for ALL the heat-treated samples. Do NOT re-blank the spectrophotometer, you only need to do blank once at the very start! In addition, use the same cuvette throughout, rinsing with distilled water and tapping dry between samples.
Table 1: Absorbances of heat-treated beetroot samples
|
Temperature (°C) |
Absorbance (525 nm) |
Mean ± SD |
|
70 |
|
|
|
70 |
|
|
|
70 |
|
|
|
60 |
|
|
|
60 |
|
|
|
60 |
|
|
|
50 |
|
|
|
50 |
|
|
|
50 |
|
|
|
40 |
|
|
|
40 |
|
|
|
40 |
|
|
|
30 |
|
|
|
30 |
|
|
|
30 |
|
|
|
Room Temp. ( ) |
|
|
|
Room Temp. ( ) |
|
|
|
Room Temp. ( ) |
|
In your own time, using the formula below determine the standard deviation (SD) for each of the temperature values and add it to each the table above:

s = standard deviation
x = each individual value
x (bar) = mean value
n = number of measurements
You should then plot a fully labelled scatter graph of mean absorbance values ± SD deviations (on y axis) versus temperature (on x axis).
What does the plotted graph tell you about the effect of temperature on the integrity of cellular membranes? Is the observed effect of temperature consistent with what you know about the structure of biological membranes? Fully explain your answer.
Finally, list at least three possible experimental errors that might have occurred during the experiment.
2023-07-11