EL2106 Signals and Systems 2022/2023
Hello, dear friend, you can consult us at any time if you have any questions, add WeChat: daixieit
EL2106
Signals and Systems
2022/2023
Fourier Series for Synthesis and Analysis of Periodic Signals
|
THE BRIEF/INSTRUCTIONS For all stages, select appropriate ranges (time, frequency etc.) for the plots to show the appropriate features of the signals and spectra. Label both axes on all plots. Throughout this assignment, the sampling frequency for all signals should be 100 kHz. 1) Periodic Discrete-Time Signal Generation (25 marks) Generate a set of discrete-time sinusoids using both Excel and MATLAB. The signals should have a specified amplitude and phase (your choices, you may decide to experiment with these), and a frequency as specified below. Plot the sample values against time and observe the resulting waveform. Use a suitable time range so as to show the relevant features of the signal. Comment on whether the observed waveform corresponds to the expected waveform and explain any significant differences. (HINT: a key word that you may wish to investigate and explain is ‘aliasing’). Use the following values (individually) for the frequency of the sinusoid: 1 kHz, 2 kHz, 48 kHz, 52 kHz, 98 kHz, 99 kHz. 2) Fourier Synthesis for Periodic Signals (25 marks) Construct a spreadsheet to synthesise periodic signals, each with a fundamental frequency of 100 Hz, using a d.c. component (a0), and a sum of ‘cos’ terms (with amplitudes given by the ak coefficients) and ‘sin’ terms (with amplitudes given by the bk coefficients). Repeat the synthesis of these signals using MATLAB. The synthesis equation is:
The ak and bk coefficients should be selectable by the user, and the signals should be synthesised with two different harmonic ranges: (a) from d.c. up to and including the 10th harmonic (i.e. N = 10). (b) from d.c. up to and including the 20th harmonic (i.e. N = 20). Use your spreadsheet, with the two harmonic ranges, to synthesise the following signals: (i) A signal f1(t) of fundamental frequency 250 Hz for which a0 = 5 V, and ak and bk are defined by the equations below:
(ii) An approximation of square wave of amplitude 10 V and fundamental frequency 250 Hz, for which you should identify formulae for a0, ak and bk using Fourier series analysis as discussed in the EL2106 classes. 3) Fourier Analysis for Quasi-Periodic Signals (40 marks) A different sampled signal will be provided (by another Excel file) to each student on or before 1st February 2023. The signal is a quasi-periodic signal of fundamental frequency 250 Hz, sampled at 100 kHz. Three practice signals (periodic and quasi-periodic) are available on Blackboard. Each file will contain 2000 samples of the signal, covering five cycles of the quasi-periodic signal (400 points per cycle). Note that slight differences are apparent between each ‘cycle’ of the quasi-periodic signals. (a) Construct a spreadsheet to perform Fourier analysis of the signal from d.c. up to and including the 20th harmonic. The analysis should include all 2000 points provided, but the calculations should be based on the correct fundamental frequency (i.e. 1 cycle is specified by 400 points corresponding to a fundamental frequency of 250 Hz). Include in your report a table listing the magnitude (Fk) and phase (φk) of each of the 20 frequency components. Evaluate the d.c. component of the signal and identify the four dominant a.c. frequency components (i.e. those with the four largest magnitudes) present in your signal. (b) Synthesise the signal using only the d.c. value and the four dominant frequency components, using the magnitude and phase values obtained from your analysis. (c) Subtract the synthesised signal from part (b) from the original signal (provided) and observe and explain the resulting difference signal. Calculate the RMS value of the difference signal and express this as a value in dB relative to the RMS value (over all five cycles) of the original signal provided. Technical Report Writing To complete the report, you will have to thoroughly research the area using reliable sources and thoroughly reference where your information and statements are coming from. The aim of the report is to be clear, concise and convey technical information to the reader, note that the reader is familiar and experienced in the area. Ensure that you aim your report for this audience. A guide on writing a technical document can be found at the following (this will also be uploaded to blackboard): https://www.theiet.org/media/5182/technical-report-writing.pdf Please read over the above document to ensure that you are clear on what a technical report is and you are clear on what you are required to complete, note the above is a guide not an explicit standard you will be required to ensure that your technical report contains the relevant information presented correctly for the reader. Presentation of assignment work Except where specifically stated in the assignment brief, assignment work submissions should be word-processed, in Microsoft Word format, with a footer comprising: your module code; date; page number. The following module learning outcomes will be assessed in this assignment: · Use time domain, frequency-domain and s-domain representations of signals and systems to analyse signal and system characteristics and system responses graphically and mathematically Describe the theory of operation and principal characteristics of simple analogue electronic devices and circuits. · Implement relevant processing techniques, such as Fourier analysis and s-plane analysis, using software tools such as spreadsheets and MATLAB, and demonstrate an understanding of the practical results acquired from the software-based implementations. Marking Criteria and Weighting Your submission will be marked in accordance with the following marking scheme:
Table 1. Marking Scheme for the Assignment |
||||||||||||||||||||||
|
PREPARATION FOR THE ASSESSMENT Please read over the guide to writing a technical document https://www.theiet.org/media/5182/technical-report-writing.pdf and ensure that you fully understand the requirements of the assessment. There will be a lecture session on the assignment and writing a technical document. Ensure that you research and read into the subject area before writing the report so that you have a good background understanding to the subject area. You will need to provide a short report, which shows the calculation of each tasks in Section 5 above with an appropriate assumption, description and comments, no longer than 1,000 words. You should use the guideline below (Table 2) to structure your report. For the final reporting submission, make sure that each page is marked with the date of completion, the page number, and the total number of pages submitted. Make sure that the front page of your submission has this information displayed prominently along with the module name and number and assignment title. Submit your reporting material with a single Word file through EL2106 Blackboard submission link with Matlab and Execl code attached in the back of the file. Your work must be referenced using Harvard Referencing system available here: https://v3.pebblepad.co.uk/v3portfolio/uclan/Asset/View/Gm3mmGk6sM3RgHZnjGfh7mm6pM. Further information to support your development will be available to view on assignment briefing session and Blackboard.
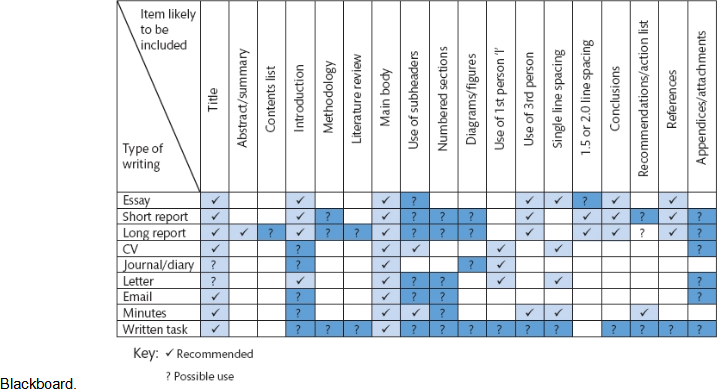
Table 2. Structural guidelines for various types of writing |
||||||||||||||||||||||
|
RELEASE DATES AND HAND IN DEADLINE Assessment Release date: 18/10/2022 Assessment Deadline Date and time: 24/03/2023 23:59 Please note that this is the final time you can submit – not the time to submit! Your feedback/feed forward and mark for this assessment will be provided in line with the universities 15 working day policy for feedback which will be the 28th April 2023 |
||||||||||||||||||||||
|
SUBMISSION DETAILS · The report should be uploaded via Blackboard to Turnitin by the deadline. · Ensure that you keep a complete copy of the work you hand in. · Remember it may take some time to upload work to Turnitin so it is recommended that work is submitted in good time before the deadline to avoid it being flagged as late. Late work · Work submitted electronically may be submitted after the deadline to the same Turnitin assignment slot and will be automatically flagged as late. · Penalties for late submission · Except where an extension of the hand-in deadline date has been approved lateness penalties will be applied in accordance with University policy as follows: (Working) Days Late Penalty 1 - 5 maximum mark that can be achieved: 40% more than 5 0% given |
||||||||||||||||||||||


2023-07-03
Fourier Series for Synthesis and Analysis of Periodic Signals