EME 5433 Quarter Car Ride Model
Hello, dear friend, you can consult us at any time if you have any questions, add WeChat: daixieit
Mechanical Engineering Department
EME 5433
Quarter Car Ride Model
You are asked to use the quarter car ride model to investigate front corner responses for road, unsprung mass and body inputs.
Analysis To Perform
Develop the quarter car response properties as a function of input frequency using two methods
1) Magnitude of the amplitude ratios presented by Gillespie, equations (5- 14), (5- 15) and (5- 16)
2) Time based analysis using the equations of motion presented by Gillespie, equations (5- 12) and (5- 13)
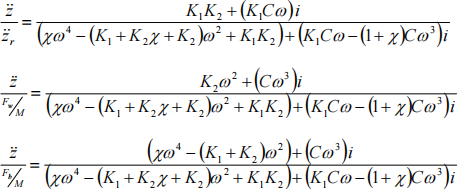
Response Gain Functions (5-14), (5-15) and (5-16)
The response gain functions presented by Gillespie are shown below
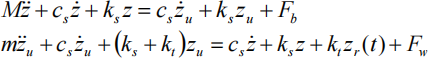
ODEs (5-12) and (5-13)
The ODEs representing the time response of the quarter car model are shown below:
Required Results
Plot #1: Response Gain Functions: Use the response gain functions to plot the sprung mass gain for road, unsprung mass and sprung mass force inputs for 0 Hz to 25 Hz. (See Gillespie Figure 5- 16 as an example)
Plots #2-#4: ODE Response: For 1 Hz, 10 Hz and 20 Hz, plot the sprung mass and road acceleration vs. time. Determine the acceleration gain for the steady-state portion of the response and denote the gain in the title of plot.
Report Contents
Please submit with following
1) A two-page report containing the required plots and tables.
![]() Page 1: Cover page
Page 1: Cover page
![]() Page 2: Required plots and an observation from the results
Page 2: Required plots and an observation from the results
2) Your MATLAB script(s) and Simulink model.
Vehicle Model Parameters
Please use the vehicle and model parameters shown below.
% Vehicle parameters
|
M = 5000/g; |
% Front corner mass [Kg] |
|
m = 500/g; |
% Front corner unsprung mass [Kg] |
|
ks = 35000; |
% Front corner suspension stiffness [N/m] |
|
cs = 2000; |
% Front corner suspension damping [Ns/m] |
|
kt = 320000; |
% Tire stiffness [N/m] |
|
Zr = 0.005; |
% Road Sine Wave Amplitude [m] |
For time based analysis of the ODEs, please use the following guidelines.
1) Solve the ODEs at the frequency of interest (f)
2) Used a fixed time sampling in Simulink of 0 : (1/(50*f): 20/f
3) Plot the time responses for the time window t = [ 15/f , 20/f ]
4) Evaluate the gain based on the specified time window of the response
2023-07-03