H17QM QUANTITATIVE METHODS 2022-2023
Hello, dear friend, you can consult us at any time if you have any questions, add WeChat: daixieit
H17QM
QUANTITATIVE METHODS
TIMED ONLINE COURSEWORK
April Examination and Assessment Diet 2022-2023
Duration: 24 Hours
CASE STUDIES
In order to gain full marks, please show full workings step by step.
Case Study 1 Maximum Word Limit 1000 words
(i) Explain how the normal distribution can be useful when making management decisions. Give examples from your own organisation to illustrate your answer. (13 marks)
(ii) The manager of a hotel in London is looking at ways of cutting costs. A major
element of hotel costs is the replacement of towels.
The life of a towel is normally distributed with an average of 180 days and a variance of 361 days 2 .
What is the probability that a towel has a lifetime of:
(a) More than 220 days?
(b) More than 145 days?
(c) Between 150 and 200 days? (4 marks)
(iii) The manager wants to test a sample of towels. He has selected 40 towels at random.
Assuming that the lifetime for an individual towel has the same normal distribution as in part (b), calculate:
(a) The probability that the average lifetime of the sample towels will be greater
than 174 days.
(b) The probability that the average lifetime of the sample towels will be less than
177 days.
(c) Calculate the upper and lower limits, symmetrical about 180 days, within which you would expect the average lifetime of the sample towels to lie with probability of 94%.
(d) State any assumptions which are implicit for these calculations. (8 marks) (Total 25 marks)
Case Study 2 Maximum Word Limit 1000 words
The London manager of a multinational chain of health clubs employed a researcher to produce a forecast of trade using several historic factors. The researcher carried out the analysis using multiple regression. The aim of the research was to identify the relationship between the annual turnover in £000s and factors such as employee numbers, the ease of transport from underground stations, the square metres available in each club and the number of treatments on offer.
Information was collected from a total of 70 health clubs in London. The variables used were:
|
Turnover: |
The annual overall turnover of a health club in £000s. |
|
Employees: |
Number of employees (full-time equivalents) . |
|
Transport: |
The number of miles from the nearest London Underground station. |
|
Size: |
The health club space in metres squared. |
|
Treatments: |
The number of different health treatments available. |
The researcher decided to analyse the data using a multiple regression package with Turnover as the dependent variable and Employees, Transport, Size and Treatments as the independent variables. Part of the computer output from the analysis is shown below.

Required:
(i) What is the regression equation that is generated by this data? Explain what this indicates. (2 marks)
(ii) Calculate the R-squared value. Explain what this measures and discuss your findings . (2 marks)
(iii) Test whether the multiple regression model is statistically significant and explain what this indicates. (4 marks)
(iv) Which, if any, of the independent variables are statistically significant? Explain your reasoning. What are the implications of these findings? (5 marks)
(v) Write a report on your findings. Discuss the usefulness of this particular model, possible improvements and make recommendations for further analyses. (12 marks) (Total 25 marks)
Case Study 3 Maximum Word Limit 1000 words
The Mayor of London has published frequent reports on local traffic and pollution problems and is trying to promote the use of bicycles. She asked her research team to conduct investigations into travel times in the city.
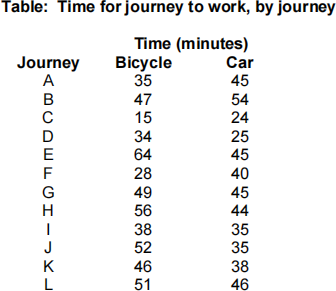
A random sample was taken of employees who worked at a large bank in the city centre. 12 employees who normally travel by bicycle were selected at random and asked about their journey to work. Each of these employees was matched with another employee who commutes from the same part of the city but who normally travels by car.
Last Monday, each of these 24 employees travelled to work using their usual method of transport. The time taken for the journey from home to the office was recorded and is shown in the table below.
Required:
(i) Using a suitable hypothesis test, determine whether the average time taken for the journey by bicycle is significantly different from the time taken by car. (7 marks)
(ii) The Mayor has now decided that her research team should have determined whether
the average time taken for the journey by bicycle is significantly less than the time taken by car. Use a suitable hypothesis test to reach a conclusion. (6 marks)
(iii) Write a report on your findings. Discuss any reservations that you may have about
the data and the hypotheses tests that have been used. (12 marks) (Total 25 marks)
Case Study 4 Maximum Word Limit 1000 words
A restaurant in London has introduced new charges for the meals on its lunch menu. The number of customers eating lunch over the last seven weeks has been summarised in the table below.

Required:
(i) Use the method of exponential smoothing to smooth the series using a smoothing constant of 0.5. Produce a forecast of the number of customers for each of the next two weeks. Describe any assumptions that you have made and discuss the
relevance of the technique you have used. (10 marks)
(ii) Describe the three major categories of forecasting techniques. Give at least two
relevant examples for each of the categories . (15 marks) (Total 25 marks)
TOTAL OF 100 MARKS
2023-06-26