ECON10062 Introductory Statistics Semester 2, 2013/14
Hello, dear friend, you can consult us at any time if you have any questions, add WeChat: daixieit
ECON10062 Introductory Statistics
Semester 2, 2013/14
This mock exam has fewer questions. The mock exam is mainly a collection of old exam questions. As this year, we did more stuff on the normal distribution and hypothesis testing, you will find only few such such question in this mock exam. But you have been given online multiple choice and exercise questions on that.
In each case only one answer is correct. In general questions give one mark, however, some questions may attract more marks (this will be clearly indicated) . Please note that there is no negative marking for incorrect answers in the mock or the actual exam on ECON10062.
1) Some data are collected on the monthly output of nails from a nail factory (measured in kg). What type of data is this best described as?
a) Count
b) Ordinal
c) Luminous
d) Nominal
e) Continuous
2) In a histogram, which of the following represents the frequency of a category?
a) The height of the ‘bar’
b) The width of the ‘bar’
c) No frequency is represented
d) The circumference of the ‘bar’
e) The colour of the bar.
3) What is the median number in the following series: 43, 40, 67, 63, 68, 54, 70, 79, 51, 40?
a) 54
b) 63
c) 52.5
d) 51
e) 58.5
4) Broadly speaking, which of the following best describes the standard deviation?
a) The largest distance of any data point to the mean
b) How far, on average, the data points lie from the mean
c) How far, on average, the data points lie from the median
d) The standard by which the data points deviate from those of the population under study
e) The same as the Z score
5) Variance is a measure of:
a) The location of a distribution
b) The spread of a distribution
c) The shape of a distribution
d) The correlation of two variables
e) The degree of kurtosis
6) Negative skewness implies:
a) The mode equals the mean equals the median
b) The mean is less than the median
c) The mean is less than the standard deviation
d) The mean is greater than the median
e) The mean is greater than the standard deviation
7) Which statement with respect to the distribution of incomes is correct?
a) The distribution of income distribution is negatively skewed as there are many incomes below the average.
b) The distribution of income distribution is symmetric
c) The distribution of income distribution is positively skewed as there are few incomes below the average.
d) The distribution of income distribution is negatively skewed as there are a few extremely large incomes.
e) The distribution of income distribution is positively skewed as there are a few extremely large incomes.
The following formulae refer to questions 8 and 9.

8) Which of these is a formula for producing a Z-score for (or standardising) a variable?
a) A
b) B
c) C
d) D
e) E
9) Which of these is a formula for the population variance?
a) A
b) B
c) C
d) D
e) None of the above
10) The Basic Contingency-Table is the data analyst’s primary tool for
a) Measuring precisely the relationship between two categorical variables
b) Exploring the relationship between two categorical variables
c) Exploring the relationship between two continuous variables
d) Measuring precisely the relationship between two continuous variables
e) Tabulating Crosses
11) The contingency table below covers data for two variables; indicating the type of secondary school that the person went to and whether they are currently a manual or non-manual worker.
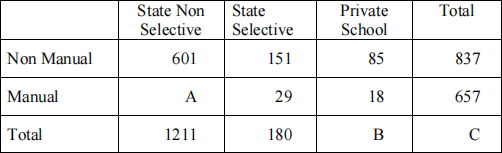
What values should fill the cells A, B and C?
a) A: 610, B: 103, C: 1494
b) A: 1812, B: 103, C: 1494
c) A: 1812, B: 57, C: 180
d) A: 1812, B: 57, C: 180
e) A: 610, B: 103, C: 1391
12) A scatter diagram plots the relationship between
a) Two scatters
b) Two ordinal variables
c) Two nominal variables
d) Two continuous variables
e) None of these
The following sample refers to questions 13 to 15
A random sample of five observations, for two variables X and Y, has been collected. The values for the data
are: X: 10, 9, 8, 7, 6.
Y: 4, 5, 6, 7, 8.
13) The sample standard deviation of random variable Y is:
a) 10
b) 2.5
c) 2.0
d) 1.4142
e) 1.5811
14) The sample covariance between X and Y is:
a) -2.0
b) 6.25
c) -2.5
d) 2.5
e) 2.0
15) A correlation coefficient of zero has been calculated; which of the following is true?
a) The two variables are not correlated in any way
b) The two variables are not linearly correlated
c) The two variables are not non-linearly correlated
d) The two variables are too similar
e) None of the above
Question 16 uses the following formulae
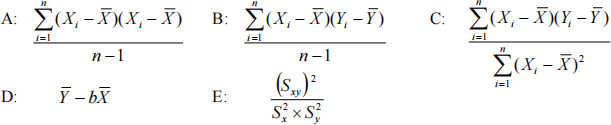
16) Which of these is a formula for the OLS slope estimator for a regression of Y on X?
a) A
b) B
c) C
d) D
e) E
Questions 17 and 18 use the following information. A random sample from a population has been taken and the following four observations on variables X and Y were recorded.
X Y
1 10 8
2 8 6
3 13 10
4 9 8
17) The OLS estimate of the slope of a regression of Y (dependent variable) on X is:
a) 1.250
b) 0.238
c) 0.571
d) 0.714
e) 1.750
18) The OLS estimate of the slope of a regression of X (dependent variable) on Y is:
a) 1.250
b) 0.417
c) 1.750
d) 0.714
e) 0.571
19) A regression model is estimated as: ![]() i = 4.5
i = 4.5 ![]() 16xi
16xi
Using the model one would be inclined to argue that a one unit increase in x will lead to:
a) A 4.5 unit increase in y
b) A 16 unit increase in y
c) A 16 unit decrease in y
d) An 11.5 unit decrease in y
e) A larger value for y
20) A regression model is estimated as: ![]() i =
i = ![]() 0.5 + 0.8 . xi
0.5 + 0.8 . xi
There is another observation with a value of x equal to 5. According to the estimated model, what value do you expect the dependent variable to take?
a) 0.3
b) 3.5
c) -4.5
d) 4.5
e) 5
21) The coefficient of determination (R2) indicates a good fit for a regression model when its value is:
a) Close to – 1
b) Greater than 1
c) Close to zero
d) Similar to the standard deviation of the dependent variable
e) None of the above
The data in the table below relates to questions 22 and 23. The table contains information about the marital status of individuals and whether they rent or own the property they live in.

22) What is the joint probability that a person is married and owns the property that they live in?
a) 0.586
b) 0.623
c) 0.690
d) 0.648
e) None of the above
23) What is the probability that a person rents the property that they live in conditional on them being widowed/divorced?
a) 0.096
b) 0.583
c) 0.255
d) 28
e) None of the above
24) In the in a university with a really large number of students, it is known that the probability of attending a course on statistics is 0.3. If a random sample of three students is taken, what is the probability that all three are attending a statistics course?
a) There is insufficient information.
b) 0.973
c) 0.3
d) 0.9
e) 0.027
25) Marks in an exam are normally distributed with a mean of 52 and a standard deviation of 13. What
percentage of students score less than 26?
a) 5%
b) 2.5%
c) 95%
d) 47.5%
e) None!
26) Which of the following, according to the ECON10062 lectures, is not true of the study of statistics? (not graded)
a) The study of statistics is important
b) The study of statistics is interesting
c) The study of statistics is useful
d) The study of statistics is relevant in many spheres of life
e) The study of statistics is boring and difficult
This information relates to Questions 27 to 30. Your company is filling milk cartons. You know that your machine fills cartons with varying amounts. But you also know that the amount filled into a carton is normally distributed with a mean of 575ml and a standard deviation of 3ml.
27) What is the probability that the filling machine will fill a carton with more than 580ml?
a) 0.2877
b) 0.9525
c) 0.0475
d) 0.0019
e) 1.67
28) What is the probability that the filling is smaller than a pint (568ml)?
a) 0.0099
b) 0.9901
c) 0.0500
d) 0.7833
e) 0.2177
29) What is the probability that the filling will larger than 568 and smaller than 572ml?
a) 0.0099
b) 0.8522
c) 0.1587
d) 0.8413
e) 0.1488
30) The 0.001% largest fillings will be larger than what volume?
a) 600.47
b) 584.00
c) 575.0
d) 584.24
e) 581.0
The following information relates to questions 31 to 32. You have two categorical variables (M and B) for which you obtained the following contingency table:
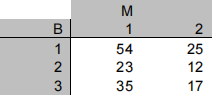
31) Calculate the χ2 statistic you would use to test whether the two random variables are independent or not. (worth 3 marks)
a) 0.0045
b) 0.0779
c) 1.7460
d) 53.3012
e) 166
32) Assume that the test statistic takes a value of 6.53 and that α = 0.10. Which of the following is correct?
a) As the test statistic exceeds the critical value we can reject the null hypothesis of independence
b) As the test statistic is larger than 1.96 we can reject the null hypothesis
c) The test statistic is smaller than the critical value and hence we cannot reject the null hypothesis.
d) The test statistic is larger than the critical value of the χ2 distribution with 6 degrees of freedom and hence we reject the null hypothesis
e) As the test statistic exceeds 4.66052 we can reject the null hypothesis of dependence
33) You asked a random sample of 60 shoppers in Market Street for their age. The average age in your sample is 43.4 years and the sample standard deviation is 6.1. You know that the average age in England is 39. Test whether the average age of shoppers in Market Street (μage) is representative of the English population. Perform a hypothesis test and use α = 0.05.
a) We use H0 : μage ≠ 39, HA : μage = 39. The relevant t-test is 5.59 and as this is larger than the critical value of 1.96 the null hypothesis is rejected and we conclude that the average age of shoppers is equal to 39.
b) We use H0 : μage ≠ 39, HA : μage = 39. The relevant t-test is 0.72 and as this is smaller than the critical value of 1.96 the null hypothesis is rejected and we conclude that the average age of shoppers is not equal to 39.
c) We use H0 : μage = 39, HA : μage ≠ 39. The relevant t-test is 0.72 and as this is smaller than the critical value of 1.96 the null hypothesis is rejected and we conclude that the average age of shoppers is equal to 39.
d) We use H0 : μage = 39, HA : μage ≠ 39. The relevant t-test is 5.59 and as this is larger than the critical value of 1.96 the null hypothesis is rejected and we conclude that the average age of shoppers is not equal to 39.
e) We use H0 : μage ≠ 39, HA : μage = 39. The relevant t-test is 0.72 and as this is smaller than the critical value of 1.645 the null hypothesis is rejected and we conclude that the average age of shoppers is not equal to 39.
34) A friend of yours studying in Birmingham asked a random sample of 70 shoppers in Birmingham for their age. The average age in your sample is 42.1 years and the sample standard deviation is 8.7. You know that the average age in England is 39. Test whether the average age of shoppers in Birmingham (μage) is larger than that of the English population. Perform a hypothesis test and use α = 0.05.
a) We use H0 : μage > 39, HA : μage = 39. The relevant t-test is 2.98 and as this is larger than the critical value of 1.96 the null hypothesis is rejected and we conclude that the average age of shoppers is equal to 39.
b) We use H0 : μage > 39, HA : μage = 39. The relevant t-test is 0.36 and as this is smaller than the critical value of 1.96 the null hypothesis is rejected and we conclude that the average age of shoppers is larger than 39.
c) We use H0 : μage = 39, HA : μage > 39. The relevant t-test is 2.98 and as this is larger than the critical value of 1.645 the null hypothesis is rejected and we conclude that the average age of shoppers is larger than 39.
d) We use H0 : μage = 39, HA : μage > 39. The relevant t-test is 0.36 and as this is smaller than the critical value of 1.96 the null hypothesis is rejected and we conclude that the average age of shoppers is equal to 39.
e) We use H0 : μage > 39, HA : μage = 39. The relevant t-test is 0.36 and as this is smaller than the critical value of 1.645 the null hypothesis is rejected and we conclude that the average age of shoppers is larger than 39.
To answer the following questions you need to listen to the following BBC More or Less programme from the 17 March 2012 (http://www.bbc.co.uk/programmes/p00p98ms)
35) Which of the following statements is most accurate when comparing the size of Poland ($470bn GDP) and Apple ($506bn share value)?
a) When comparing the size of a company and a country it is most sensible to compare the country’s GDP to the company’s share value.
b) It is conceptually impossible to establish the added value for a company.
c) Comparing Poland’s GDP to Apple’s share value is not appropriate as the GDP refers to a particular year but a share value reflects expectations over the future.
d) When calculating Apple’s added value we would find it to be even larger than its share value.
e) In order to make Poland’s GDP comparable to Apple’s share value that takes expectations about the future into account we should multiply Poland’s GDP by 5.
36) One of the Millennium Development Goals refers to access to clean water and in particular set out to half the number of people that have no access to clean water. Watch the following news clip of the BBC: http://www.bbc.co.uk/news/world-17277520. Which of the following statements is incorrect?
a) In the BBC news clip it is reported that the estimate of people without access to clean drinking water has reduced from 23% to 11% of the world’s population and hence the above goal has been achieved.
b) Estimating the proportion of people that have access to safe water supplies is not the same as the proportion of people that actually use that water supply.
c) The World Health Organisation (WHO), for the purpose of this report assumed that an improved water source is equal to a safe water source.
d) Despite all the uncertainties regarding measuring the proportion of people with access to safe water the WHO is fairly certain that overall the above goal has been achieved.
e) The news release by the WHO regarding this achievement neglected to highlight the uncertainties with respect to estimating the proportion of people that have access to safe water.
37) Which of the following statements with respect to the ECON10062 exam is correct?
a) Exam questions will be identical to those in the mock exam just with different numbers.
b) If I can just get the questions in the mock exam right I will be all good for the exam.
c) The final exam will not contain any surprising questions.
d) As the lecture notes were complete there was no point in going to the lectures.
e) I have to be on top of the material to be able to answer questions which will be somewhat different to those I already saw.
2023-06-26