ECON 211 SPRING 2023 ASSIGNMENT #6
Hello, dear friend, you can consult us at any time if you have any questions, add WeChat: daixieit
ECON 211 SPRING 2023 ASSIGNMENT #6
Market Equilibrium – Supply and Demand
Q1: (10 points) Suppose market demand is P = 100 – ¼ QD and market supply is P = ½ QS .
a) (1 point) Sketch the demand and supply curves.
b) (1 point) Find equilibrium price and quantity in the competitive market.
STEP 1: equilibrium requires S = D P = 100 – ¼ QD and P = ½ QS .
STEP 2: Isolate Q and solve Q = (100)/( ½ + ¼) = 133.3
STEP 3: solve for P P= 100 – ¼ QD = 100- ¼ (133) = 66.6
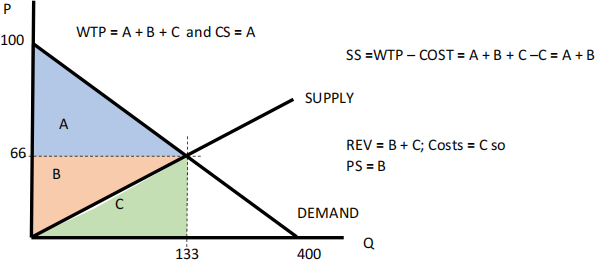
c) (1 point) Calculate the consumers’ willingness to pay (WTP), expenditures, and Consumer Surplus.
![]() Willingness to Pay (WTP) is the area under the demand curve:
Willingness to Pay (WTP) is the area under the demand curve:
WTP= 133 * (100 + 66)/2 = 11,111
![]() Expenditures are what they actually pay: Exp = P Q = 66 *133 = 8,888
Expenditures are what they actually pay: Exp = P Q = 66 *133 = 8,888 ![]() Consumer Surplus is the difference between WTP and Expenditures: WTP – Exp =
Consumer Surplus is the difference between WTP and Expenditures: WTP – Exp =
11,111 – 8,888 = 2,222
d) (1 point) Calculate the firms’ costs, revenues, and Producer Surplus.
![]() Cost is the area under the supply curve:
Cost is the area under the supply curve:
Cost= 133 * (66)/2 = 4444
![]() Revenues are what they actually receive: Exp = P Q = 66 *133 = 8888
Revenues are what they actually receive: Exp = P Q = 66 *133 = 8888 ![]() Producer Surplus is the difference between Revenue and Costs: Rev – costs = 8888 -
Producer Surplus is the difference between Revenue and Costs: Rev – costs = 8888 -
4444 = 4444
e) (2 points) What is the Social Surplus? Recall SS = CS + PS or SS = WTP-COSTS. Show that any deviation from the market equilibrium implies that social surplus falls.
Social surplus is defined to be SS = WTP – costs. SS at Q = 133 is 6666. See table. To show that any deviation from Q = 133, all we have to do is show that at Q = 120 or Q = 135 that SS falls.
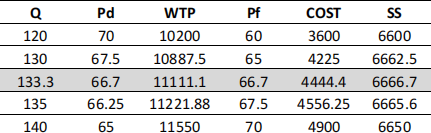
The idea is that we are trading off WTP with costs. Only when the marginal WTP (given by the demand curve) is equal to the marginal cost (given by the supply curve) are we maximizing social welfare. Failure to maximize SS means we have a deadweight loss (DWL). If Q = 120, then the DWL = 6666 - 6600 = 66
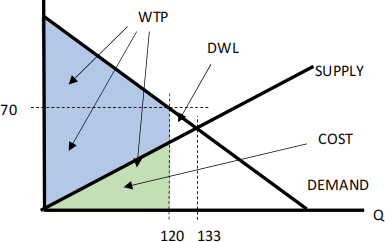
f) (2 points) Now suppose the government imposes a consumption tax of $10. What is the impact on equilibrium quantity in the market?
The $10 tax on Consumption will lower the demand curve by $10.

SOLUTION:
STEP 1: equilibrium requires S = D P = (100-10) – ¼ QD and P = ½ QS .
STEP 2: Isolate Q and solve Q = (100 - 10)/( ½ + ¼) =120
STEP 3: solve for P consumer P = 100 – ½ QD = 100- ¼ (120) = 70
STEP 4: solve for P firm P = ½ (120) = 60
The tax reduces market consumption and output. Essentially, consumers see higher prices while firms see lower prices. Equilibrium arises at a lower Q.
g) (1 point) What is the impact on CS and PS? Discuss.
Consumer Surplus = WTP – Exp = (100 + 70)/2*120 – 70*120 = 10200 – 8400 = 1800 So CS falls since the price consumers pay rises
Producer Surplus = Rev – COSTS = 60 *120 – (60)/2*120 = 7200 – 3600 = 3600
So PS falls since the price firms get falls
h) (1 point) What is the deadweight loss (DWL) of the consumption tax?
Social surplus is equal to CS + PS + tax revenue = 1800 +3600 +10*120= 6600
or
Social surplus is equal to WTP – COST = 10200 – 3600 = 6600
The maximum SS = 6666 so the DWL is 6666 – 6600 = 67
Alternately: it is the triangle with width (133-120)=13.33 and height 10. So area is 13.33 * 10/2 = 66.67
Q2: (10 points) Suppose we have n firms each with an individual supply curve of QS = ¼ P. Assume that firms have a quasi-fixed cost of $5000 (that is COST= 0 if they shut down but costs = 5000 + variable costs if they are open). There are 1000 consumers with individual demand QD = 100 –
¼ P.
a) (2 points) Let’s start with n = 500 firms. What is the equilibrium market price, output per firm, and consumption per consumer?
STEP 1: equilibrium requires QD = QS hence m (100 – ¼ P) = n (¼ P)
STEP 2: Solve for P: P = (100m)/(m/4 + n/4) = $266.67
STEP 3: Consumption per person QD : qD = 100 –¼ P = 100- 266/4 = 33.33
STEP 4: Output per firm QS : qS = ¼ P = 266/4 = 66.67
Check: total consumption is 1000 * 33 = 33,333
total supply 500 * 66 = 33,333 therefore OK
b) (3 points) Calculate Total Consumer Surplus, Total Producer Surplus, and Social Surplus.
Note: we need to invert the demand curve to find WTP and CS: P = 400 – 4Qd Individual CS = WTP – EXP = (400 + 266)/2*33 - 266*33 = 11,111 – 8,888= $2,222
Or CS= (400 - 266)*33/2 = 2,222
Total CS = 1000 *2,222= $2,222,222
Individual PS = REV – COST = 266 * 66 - ( 5000 + 266*66/2) = 17,778 – 13,889= $3,889
Total PS = 500 *3889= $1,944,444
Total SS is CS + PS = $4,166,667
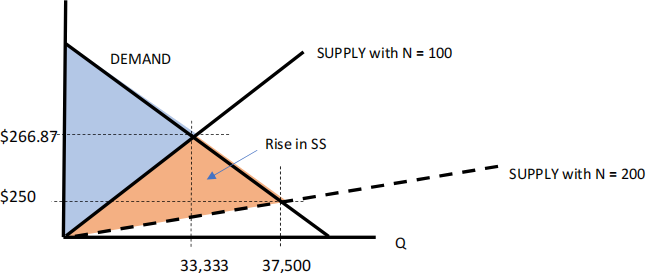
c) (2 points) Now suppose the number of firms rises to 600. What is the new equilibrium market price, output per firm, and consumption per consumer? Compare
Here we just redo the steps above from (a)
STEP 1: equilibrium requires QD = QS m (100 – ¼P) = n(¼ P)
STEP 2: Solve for P: P = (100m)/(m/4 + n/4) = $250
STEP 3: Consumption per person QD : qD = 100 –¼ P = 100- 250/4 = 37.5
STEP 4: Output per firm QS : qS = ¼ P = 250/4 = 62.5
Check: total consumption is 1000 * 37.5 = 37,500
: total supply 600 * 62.5 = 37,500 therefore OK
Notice that P falls so each consumer raises consumption while each firm gets a little smaller. The idea is that the aggregate supply curve rises which lowers the price as we move down the demand curve. However, the rise in the number of firms (by 20%) dominates the fall in per firm output ( a fall of 6.25%) so total output rises.
d) (3 points) How does total Consumer Surplus, Producer Surplus, and Social Surplus change? Discuss.
As above: we can recalculate but with the new price and quantity;
CS individual rises to 2,813 with the lower prices
while PS per firm falls to 2,813 since the price they receive is lower.
Total SS is CS + PS = 4,500,000 which rises. The idea is that entry lowers the price and, as long as there is not too much entry, SS will rise.
Q3: (10 points) (uses Q2) .
a) (5 points) Suppose firms are free to enter/exit. What is the equilibrium number of firms in this market? Eg: at what value of n ensures that each firms has zero profits.
The idea is that we need to calculate a new equilibrium where individual firm profits are zero. When N = 500, firms earned a surplus of $389. When N = 600, firms earned a surplus of $2813. So we need more firms to continue to drive P down.
STEP 1: solve for market Price as a function of N: P = (100m)/(m/4 + N/4)
STEP 2: so firm’s output is : QS = ¼ P = ¼ (100m)/(m/4 + N/4)
STEP 3: Solve for N that ensure profits = 0. Profit = REV – COSTS = P Qs - (5000 + P * QS/2) = 0. This is one equation in N but is a quadratic so awkward to solve by hand.
I solved using excel. N = 1000

b) (5 points) Show that social surplus is at a maximum given free entry/exit. Why is this the case?
All we have to do is look at SS around n = 1000. But I will do it for the table above. As you can see, any deviation from N = 1000 lowers SS. This is long-run equilibrium. Any more firms and the rise in costs will exceed the rise in WTP. Any less and the fall in WTP is larger than the fall in costs. Socially optimal entry is when we have LR equilibrium with profits equal to zero.

TOTAL: 30 points
2023-06-26
Market Equilibrium – Supply and Demand