ECON 211 SPRING 2023 ASSIGNMENT #5 PROFIT MAXIMIZATION AND SUPPLY
Hello, dear friend, you can consult us at any time if you have any questions, add WeChat: daixieit
ECON 211 SPRING 2023 ASSIGNMENT #5 PROFIT MAXIMIZATION AND SUPPLY
Q1: (10 points) Let Q(L) = 12L2 – (L3)/4 with costs = 1000 + 50L. Let the price of output be P = $1..
a) (3 points) Complete the table on the next page. You can do this in excel or by hand.

b) (1 point) Graph revenues and costs as a function of Q: Can you explain why is revenue linear in output (a straight line) but costs are not linear?
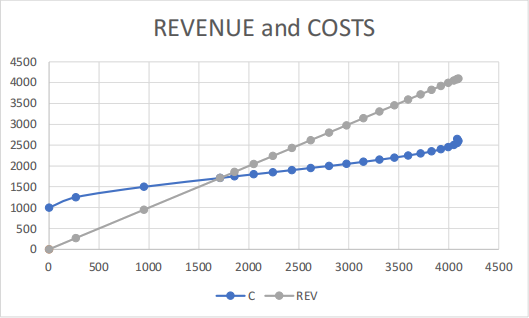
REVENUE: revenue is linear in output because all we are doing is multiplying PxQ and P is fixed at $1. So the slope of the revenue function is P. eg take L =10 and Q = 950. Revenue is 950 So if we divide 950 by 950 we get 950/950 = +1.
COST: costs are increasing in Q but not at a steady rate. This occurs because the APL is rising then falling (see assignment #4). That means that to raise output is easy at the start but hard at the end. For instance, for L = 5-10 we have output growing from 268 to 950; more than tripling. For L = 20-25 we have output growing from 2800 to 3593 or a rise, about 40%. But each time, costs rose by $500.
c) (1 point) What is the profit maximizing level of Q from the table?
The maximum profit is $1550 at L =30 and Q= 4. In the figure, it is the point of maximal distance between revenue and costs,
d) (1 point) Show the break-even level of Labour and Output. That is, what is the minimum level of L and Q that ensure positive profits. Why do we need to raise output high enough to break even?
The break-even point is where revenue equals costs or profits equal zero. This occurs at L = 14.24 (or 15 is close enough) and Q = 1712. Any labour less, and costs are too high.
The idea is that we have a fixed cost of $1000. To get the average fixed costs down, we need higher outputs. Recall that AC = AVC + AFC and that AC has to be above P = $1 for a profit. By driving AFC down, we can increase revenue faster than costs.
e) (1 points) Why is it true that, at the optimal output, marginal cost = $1. Give the intuition. Profit maximization implies that we need marginal revenue equal to marginal cost: MR = MC
If MR > MC then we should raise output. That is, the rise in revenue of one more unit sold exceeds the costs of that unit. If MR < MC then we should lower output. Hence we neither raise nor lower when they are equal.
Since the increase in revenue is simply the market price of $1, it must be the case that mc=$4 as well.
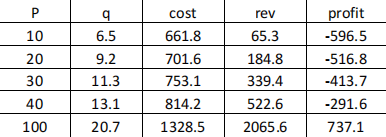
f) (3 points) Suppose P falls to $0.5. Will the firm choose Q = 0 (eg shut-down). Explain.
A firm shuts down if, the best it can do is loss 1000 which is the fixed costs. If it can earn some profit on its labour (called an operating profit) then is can pay off some of the fixed costs.
See table: at L = 27 we have Q = 3827 and profits are -436. This is better than L= 0 with Q=0 and profit = -1000.
Therefore, the firm will not shut-down. Note that if P falls below 0.3472 then L=0 is optimal since profits, if they operate, will be worse than just losing 1000.
Note also from Assignment #4: min AVC = 0.347 and minAC = 0.612
Hence as long as P>min AVC, the firm remains open.
As long as P>min AC, the firm earns a positive profit
Q2: (10 points) Consider the following production function: Q = K1/3 L1/3 .
Let the price of output be P = $100 and factor prices w = $5 and r = $10.
a) (3 points) Assume that K is fixed at 64. What are the short-run costs? C=wL + r(64)?
STEP 1: given the fixed K = 64. We have Q = K1/3 L1/3 = 4 L1/3
STEP 2: isolate and solve for L: L= (Q/4) 3 = Q3/64
STEP 3: insert L and K into cost = rK + wL C= Q3/64 w + 64r = 5/64 (Q)3 + 640
So C(Q) = 5/64 (Q)3 + 640
b) (1 point) Plot cost versus output. Show that costs are accelerating. Why is this the case? (hint. What are the returns to scale?)

The idea here is that this production function has Decreasing Returns To Scale. This DRS happens even if we could change K. We can’t so the production function is Q = 4L1/3 . If we triple L, we would only double Q.
c) (1 point) What is the firm’s optimization problem?
The firm’s problem is to choose Q (and hence L) to maximize profits
MAX Q [ P Q – COSTS] 0r MAX Q [ 100 Q – 5/64 (Q)3 - 640]
d) (3 points) What is the supply function for this firm? Eg, what is the relationship between market prices and the firm’s optimal choice of output. Hint: look at MC = P where MC = (15/64)Q2 . Confirm that higher P leads to higher Q.
Firm’s maximize profits when MC = P. So we solve for this to solve for Q as a function of P.
STEP 1: Marginal Cost = P: 15/64 (Q)2 =P
STEP 2: isolate Q: Q2 = 64P/15
STEP 3: solve for Q: Q = (64/15)1/2 P1/2 = 2.06 P1/2
This is the firm’s supply curve. The greater the P, the higher the Q.
e) (2 points) Graph the supply curve. Discuss its shape (eg why does the slope increase?).
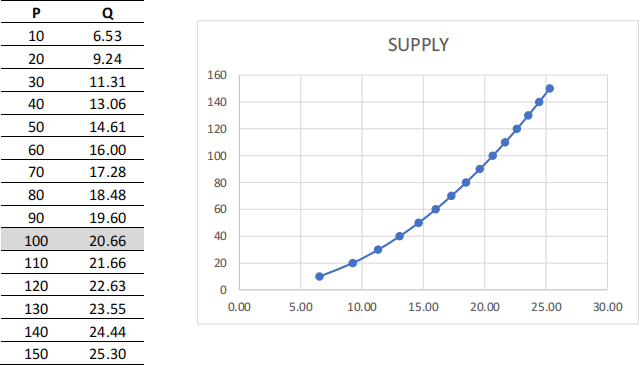
The slope is rising since we have diminishing marginal product in L and hence diseconomies of scale. That is, to double output we need more than a doubling of L and so more than a double of costs. Hence price has to more than double to offset the accelerating marginal costs.
ALTERNATIVE USING EXCEL:
STEP 1: pick a price and then use ‘SOLVER’ to find optimal Q where we maximize [100 Q – 5/64 (Q)3 – 640] by choosing Q given P
STEP 2: pick a new price and then use ‘SOLVER’ to find optimal Q
Continue:
Plot prices and optimal Qs
Q3: (10 points) Consider a firm that employs capital (K) and labour (L) and uses the production technology Q = 3K + 2L. Let factor prices be r = $40 for capital and w = $20 for labour.
a) (2 point) What is the firm’s cost minimization problem?
The firm’s problem is to choose L and K that minimizes cost of attaining Q MIN L, K [ wL + rK] subject to Q = 3K + 2L.
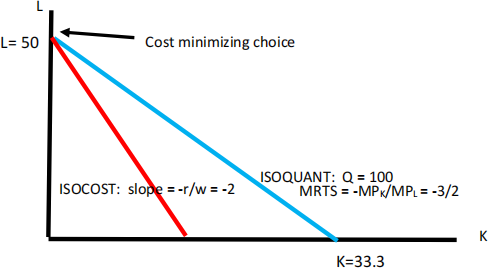
b) (3 points) Plot the isoquant for Q = 100. What is the Marginal Rate of Technical Substitution (MRTS)?
The MRTS = MPK/MPL = - 3/2
To produce Q = 100, we need (33.33 units of K and zero L) or (0 units of K and 50 L). We can write this as Q(33.33, 0) = 100 and Q(0,50) = 100
c) (2 points) For any output Q, what is the optimal combination of K and L given the input prices above?
As this is perfect substitutes, we need to evaluate MPL/w versus MPK/r
MPL/w = 2/20 and MPK/r = 3/40
Therefore, the contribution to output per dollar spent is higher on L. Hence L>0 and K=0 At the cost minimization will have K = 0 and L = Q/2
d) (2 point) What is the cost function? Confirm C(Q=100) = $1000
STEP 1: costs = wL + rK = w Q/2 + r (0) = w/2 Q.
STEP 2: so C(Q) = 20/2 Q. = 10Q
Hence Q = 100 implies Costs = 10 (100) = $1,000
e) (1 point) Given the above, what must the supply curve look like in long-run equilibrium? This implies that the supply curve is horizontal at P = $10
If P >$10, then the firm earns a positive profit on each unit of output Q so will want to produce as much as they can.
If P <$10, then the firm loses profit on each unit of output Q so will not want to produce anything.
Recall that the supply curve is where MC = P. MC = $10 so we must have equilibrium where P =$10 as well.
TOTAL: 30 points
2023-06-26