COMP3308/3608 Artificial Intelligence, s1 2023 Week 12 Tutorial exercises
Hello, dear friend, you can consult us at any time if you have any questions, add WeChat: daixieit
COMP3308/COMP3608 Artificial Intelligence
Week 12 Tutorial exercises
Unsupervised Learning (Clustering)
Exercise 1. K-means clustering (Homework)
Given is the one-dimensional dataset: {5, 7, 10, 12}. Run the k-means clustering algorithm for 1 epoch to cluster this dataset into 2 clusters. Assume that the initial seeds (cluster centers) are c1=3 and c2=13 and that the distance measure is the absolute distance between the examples. Show the clusters at the end of the epoch and the new cluster centers.
Solution:
epoch1 – start:
distances to c1=3:
d(c1=3, 5)=2, d(c1=3, 7)=4, d(c1=3, 10)=7, d(c1=3,12)=9
distances to c2=13:
d(c2=13,5)=8, d(c2=13,7)=6, d(c2=13,10)=3, d(c2=13,12)=1
The smaller distance for each example is in bold.
=> The new clusters will be: K1={5,7} and K2={10,12}
The centroids for the new clusters are (5+7)/2=6 and (10+12)/2=11.
Exercise 2. Nearest neighbor clustering
Use the Nearest Neighbor clustering algorithm to cluster examples A, B, C and D described by the following distance matrix. Suppose that the threshold t is 3.
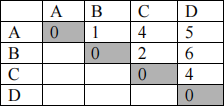
Solution:
• A is placed in a cluster by itself, so we have K1={A}.
• We then look at B if it should be added to K1 or be placed in a new cluster. As d(A,B)=1<t, B is added to K1, i.e. K1={A,B}
• C: added to K1 or placed in a new cluster? d(C,A)=4, d(C,B)=2; the smallest one is d(C,B) and it is <t => C is added to K1, i.e. K1={A,B,C}
• D: added to K1 or placed in a new cluster? d(D,A)=5, d(D,B)=6, d(D,C)=4; the smallest is d(D,C) and it is >t => D is placed in a new cluster K2={D}
• Final clusters: K1={A,B,C), K2={D}
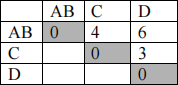
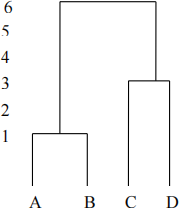
Exercise 3. Hierarchical clustering – single link agglomerative algorithm
Use the single link agglomerative clustering to group the data described by the following distance matrix. Draw the dendrogram.

Solution:
Level 0:
(0, 4, {A}, {B}, {C}, {D})
Level 1: we can merge A and B as d(A,B)<=1
(1, 3, {A,B}, {C}, {D})
The updated matrix is:
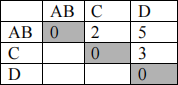
Note: the distance between {A,B} and C using the single link is min(d(A,C), d(B,C))=min(4,2)=2. Similarly, the distance between {A,B} and D is 5.
Level 2: we can merge {A,B} and C as the distance between them<=2
(2, 2, {A,B,C}, {D})
The updated matrix is:
Level 3: we can merge {A,B,C} with D as the distance between them is <=3
(3, 1, {A,B,C,D})
Stop: all items are in 1 cluster.
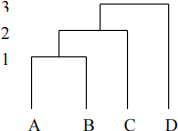
Dendrogram:
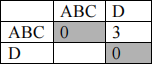
Exercise 4. Hierarchical clustering – complete link agglomerative algorithm
The same task as in the previous exercise but using the complete link distance measure.
Solution:
Level 0:
(0, 4, {A}, {B}, {C}, {D})
Level 1: we can merge A and B as the distance between them is <=1
(1, 3, {A,B}, {C}, {D}) as d(A,B)<=1
The updated matrix is:
Note: the distance between {A,B} and C using the complete link is max(d(A,C), d(B,C))=max(4,2)=4. Similarly, the distance between {A,B} and D is 6.
Level 2: we can’t merge any clusters as all distances are >3
(2, 3, {A,B}, {C}, {D})
Level 3: we can merge C and D as the distance between them is <=3
(3, 2, {A,B}, {C,D}
The updated matrix is:
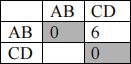
Level 4: no merging
Level 5: no merging
Level 6: we can merge the 2 clusters
Stop: all items are in 1 cluster
Dendrogram:
Exercise 5. Clustering using Weka
Load the glass.arff data. It describes different types of glass based on their chemical components. The identification of different types of glass is important for criminological investigations – it can be used as evidence.
There are 9 attributes: 1) RI: refractive index and 2)-9) measurement of the following chemical elements: Na (Sodium), Mg (Magnesium), Al (Aluminum), Si (Silicon), K (Potassium), Ca (Calcium), Ba (Barium) and Fe (Iron).
There are 7 classes (types of glass) but for one of them there are no examples in the dataset, so there are 6 classes:
Type of glass: (class attribute)
1) building_windows_float_processed
2) building_windows_non_float_processed
3) vehicle_windows_float_processed
4) vehicle_windows_non_float_processed (none in this database)
5) containers
6) tableware
7) headlamps
1. From the Preprocess tab:
a) Select the class attribute “type” and remove it. Clustering is an unsupervised method and doesn’t use the class attribute.
b) Normalise the data using unsupervised->attribute->Normalize filter. This is important as the clustering algorithms we will be applying (k-means and hierarchical) are distance-based.
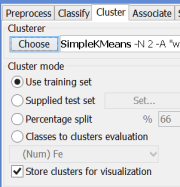
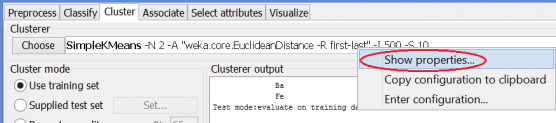
2. To perform clustering using the k-means algorithm, click the Cluster tab and select the SimpleKMeans algorithm. By default it uses k=2 clusters and Euclidean distance. You can see and change the parameters of the algorithm by right clicking on the name, then Show Properties.
3. Evaluation method: check that Use training set is selected and that Store clusters for visualization is also selected (both should be the default options).
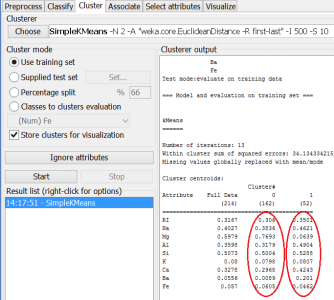
4. Run the k-means algorithm and analyse the output. It shows the within cluster sum of squared errors (the smaller the better, i.e. high cohesion) and also the centroids for each of the two clusters (circled in the figure below):
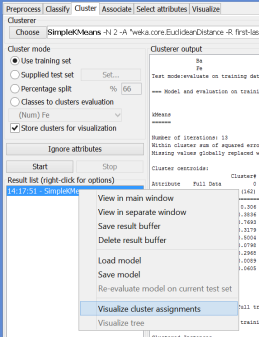
You can visualize the data by using Visualize cluster assignments:
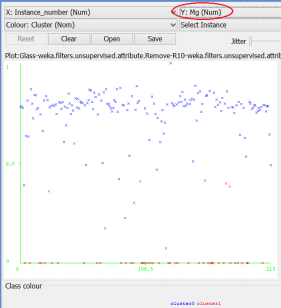
Try different attributes for Y to see which attributes are more discriminative for the 2 clusters. E.g. Mg separates the 2 clusters relatively well:
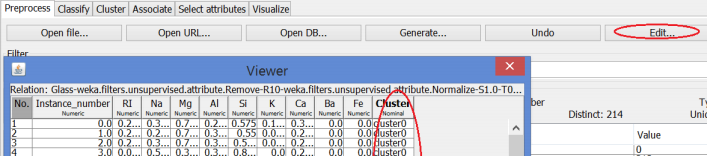
You can also save the clustering results by clicking Save on the Visualization panel. The results will be saved in a .arff file. For each example, at the end of the line, Weka will add the cluster of the example (clusterr0 or cluster1). You can open and view the saved file with Weka:
Experiment with different number of clusters: right click on SimpleKMeans -> Show properties, then change k:
5. Weka also includes an implementation of the hierarchical agglomerative algorithm; it is called HierrachicalClusterer:

It includes different ways to measure the distance between the cluster – single link, complete link, etc. Explore them from Show properties -> More. Select one of them, e.g. the complete link and run the algorithm.
You can visualise the results pairwise as in the k-means algorithm and can also plot the hierarchical tree:

Additional exercises to be done at your own time
Exercise 6. K-means clustering
Use the k-means algorithm and Euclidean distance to group the following 8 examples into 3 clusters: A1=(2,10), A2=(2,5), A3=(8,4), A4=(5,8), A5=(7,5), A6=(6,4), A7=(1,2), A8=(4,9).
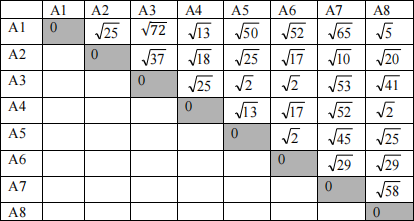
The distance matrix based on the Euclidean distance is given below:
Suppose that the initial seeds (centroids) are A1, A4 and A7. Run the k-means algorithm for 1 epoch only. At the end of this epoch show:
a) the new clusters (i.e. the examples belonging to each cluster)
b) the centroids of the new clusters
Solution:
a) d(x,y) denotes the Euclidean distance between x and y
K1, K2 and k3 are the three clusters
seed1=A1=(2,10), seed2=A4=(5,8), seed3=A7=(1,2)
epoch1 – start:
A1:
d(A1, seed1)=0 as A1 is seed1
d(A1, seed2)>0
d(A1, seed3)>0
=> A1 ![]() K1
K1
A2:
d(A2, seed1)=d((2,5), (2,10))=sqrt((2-2)^2+(5- 10)^2)=sqrt(25)
d(A2, seed2)=d((2,5), (5,8))=sqrt((1-5)^2+(5-8)^2)=sqrt(18)
d(A2, seed3)=d((2,5),(1,2))=sqrt((2-5)^2+(5-2)^2)=sqrt(10)
=> A2 ![]() K3
K3
A3:
d(A3, seed1)=d((8,4), (2,10))=sqrt(72)
d(A3, seed2)=d((8,4), (5,8))=sqrt(25)
d(A3, seed3)=d((8,4), (1,2))=sqrt(53)
=> A2 ![]() cluster2
cluster2
A4:
d(A4, seed1)>0
d(A4, seed2)=0 as A4 is seed2
d(A4, seed3)>0
=> A4 ![]() K2
K2
A5:
d(A5, seed1)=d((7,5), (2,10))=sqrt(50)
d(A5, seed2)=d((7,5), (5,8))=sqrt(13)
d(A5, seed3)=d((7,5), (1,2))=sqrt(45)
=> A5 ![]() K2
K2
A6:
d(A6, seed1)=d((6,4), (2,10))=sqrt(52)
d(A6, seed2)=d((6,4), (5,8))=sqrt(17)
d(A6, seed3)=d((6,4), (1,2))=sqrt(29)
=> A6 ![]() K2
K2
A7:
d(A7, seed1)>0
d(A7, seed2)>0
d(A7, seed3)=0 as A7 is seed3
=> A7 ![]() K3
K3
A8:
d(A8, seed1)=d((4,9), (2,10))=sqrt(5)
d(A8, seed2)=d((4,9), (5,8))=sqrt(2)
d(A8, seed3)=d((4,9), (1,2))=sqrt(58)
=> A8 ![]() K2
K2
end of epoch1
new clusters: K1= {A1}, K2={A3, A4, A5, A6, A8}, K3={A2, A7}
b) centers of the new clusters:
K1: (2,10)
K2: (8+5+7+6+4)/5, (4+8+5+4+9)/5=(6,6)
K3: ((2+1)/2, (5+2)/2)=(1.5, 3.5)
2023-06-26
Unsupervised Learning (Clustering)