ECON 211 2023 SPRING ASSIGNMENT #1
Hello, dear friend, you can consult us at any time if you have any questions, add WeChat: daixieit
ECON 211 2023 SPRING ASSIGNMENT #1
Q1: (10 points) Cobb-Douglas: U = X1/3Y2/3
a) (2 point) Rank the bundles (10, 0), (0,10), (5,5,) and (6,4)
Here we just calculate the Utility and then rank the bundles from highest utility to lowest utility

So we have utility of (10, 0) and (0, 10) both equal to zero. The idea with Cobb-Douglas utility is that we only get utility if we have some of both goods. Failure to have a good yields zero utility.
We also have U(6,4) = 4.58 which is lower than U(5,5). The idea here is that the consumer values Y more than X so the slightly more Y yields higher utility.
b) (2 point) Draw the indifference curve through (5,5)
To graph the indifference curve, we need to express Y as a function of the desired utility and the quantity of X. So we fix U = 5 and then solve for Y:
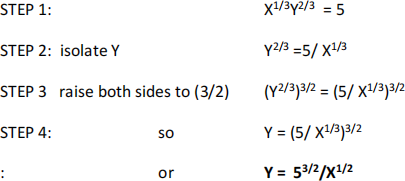
We then build a table where we pick values of X, and then calculate the value of Y that achieves the target utility. I then check by recalculating the Utility to ensure I have U = 5. So all these combinations of a particular X and its corresponding Y yields the same utility.

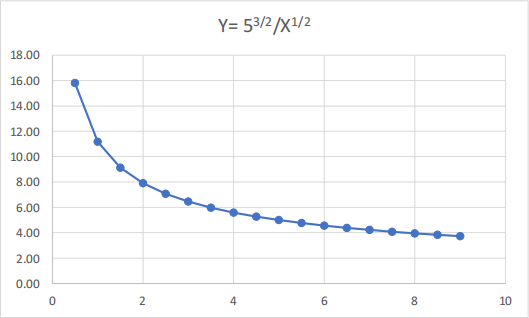
Below is a plot of the relationship where U = 5 hence passes through (5,5).
In EXCEL use the ‘scatter plot’ tab under “INSERT” and ‘Charts’
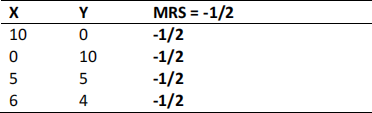
c) (2 point) Calculate the MRS at bundles (10, 0), (0,10), (5,5), and (6,4)
The MRS is defined to be the ratio of marginal utilities: It is the slope of the indifference curve.
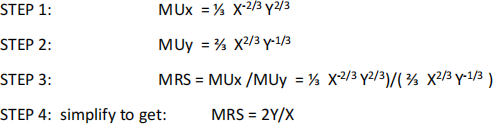
We now use the bundles and insert the values to calculate MRS

Defn: The MRS measures the willingness to give up Good Y to get more of Good X.
Notice that, when X is large (eg move to the right) and Y is small, the slope is also smaller. In the figure above, the slope of the indifference curve is very shallow when we move to the right. When X is small (move closes to zero) the slope is very high. The more we already have of Good X, the less we are willing to give up good Y hence the lower the slope as we move to the right in the graph above.
d) (2 point) Explain why this utility function is Strictly Convex.
Def:n preferences are convex if “they are bowed in” page 5 in the text A more formal definition is that, for any two points on the indifference curve, a combination leads to higher utility and hence one would be on a higher indifference curve. By visual inspection, the indifference curve above is strictly convex since I can draw a line between any two bundles and a point on that line must be above it. It is clearly curved in the way that we define convex.
Alternately: Consider two points on the indifference curve (5, 5) and (4, 5.6) both with U=5.
Take a linear combination with ½: so the new bundle is (4.5, 5.29). This has U=5.02 so is on a higher indiff curve.
e) (2 point) Explain why this utility function is Strictly Monotonic.
Def:n preferences are monotonic if “more is better” - page 3 in the text says “More is Better: If bundle A represents more of at least one good, and no less of any other good, than bundle B, then A is preferred to B.”
We can see that U(5,5) = 5. But U(6, 5) = 5.31 and U(5,6) = 5.65. Since increasing either X or Y increases utility, it means that these bundles are preferred to (5,5). So more is better.
Q2: (10 points) Perfect Complements: Let U = X + 2Y
a) (2 point) Rank the bundles (10, 0), (0,10), (5,5,) and (6,4)
The way to calculate the Utility is to first insert the values of X and Y and complete any calculation within the brackets. So U(10, 0) = 10 + 2*3 = 16. Similarly U(5,5) = 5 + 2*5 = 15

Here, as long as any of the bundles have positive quantities, we will have positive utility. Good y is ‘more preferred’ so more of Y, rather than X, yields higher utility. But both can yield utility even if the other is zero. Eg I get benefits from drinking COKE or PEPSI. I get more benefits from COKE since this is my preferred brand.
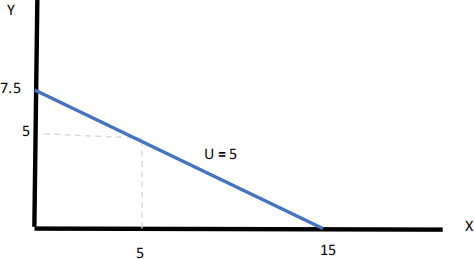
b) (2 point) Draw the indifference curve through (5,5)
From above, U (5,5) = 15. What other combinations give us U = 15? We get the same utility with Y=7.5 and X=0. Or X=15 and Y = 0. But any combination on the line also offers U =15. So X=1 and Y = (15-1)/2 = 7 also works.
c) (2 point) Calculate the MRS at bundles (10, 0), (0,10), (5,5), and (6,4)
Recall that the MRS = MUx/MUy. So the question is whether an increase in X or in Y contributes to an increase in Utility. The answer is yes. Notice that the MRS has only one value independent of the bundle. Again, MRS is the slope of the indiff curve which is just a line. In this case, I am willing to give up 1 unit of Y to get 2 units of X. eg Y is twice as good for me.
d) (2 point) Explain why this utility function is Weakly Convex.
Yes, the function is (weakly) convex. Recall we are looking for indifference curves that are bowed in. Alternately, and two combination of two bundles either raises utility or, at least, does not lower, utility. By inspection, the indiff curve is a straight line so has ‘flat spots’ . Hence a linear combination of any two bundles on an indiff curve yields exactly the same utility hence is weakly convex.
e) (2 point) Explain why this utility function is Strictly Monotonic.
Yes, the function is strictly monotonic. If we start (5, 5), a rise in either X or Y will raise utility. U(5,5) = 15 but (5 + 0.01 ,5) has higher utility. Similarly for (5, 5 + 0.01). hence any small rise in either X or Y raises utlity.
Q3: (10 points) Budget Constraints: Suppose a household has funds of m = $ 4 0 0 . There are two goods with prices P1 = $ 10 and P2 = $ 20.
a. (3 points) Draw the budget line.
A budget line tells us the combinations of goods 1 and 2 that exactly equal our income. That means P1Q1 + P2Q2 = M.
We can rewrite this as Good 2 as a function of Income and of how much we spend on good 1.
STEP 1 P2Q2 = M - P1Q1
STEP 2 Q2 = M/ P2 – (P1 / P2) Q1
Hence Q2 = 20 – 1/2 Q1
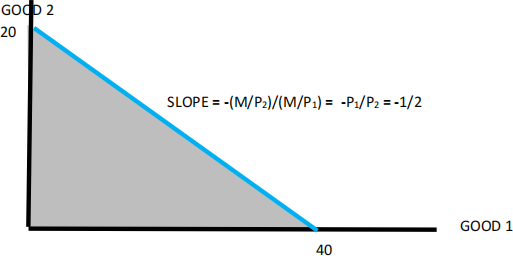
This is the equation of a line with vertical intercept I/ P2 and slope – (P1 / P2) . in a diagram we have:
Plotting: maximal Good 1 = I/P1 = 400/10 = 40 and maximal Good 2 = I/P2 = 400/20 = 20
b. (3 points) Now suppose the household receives 10 units of good 1 for free, but is not allowed to sell them. Additional units of good 1 can be purchased at a price P1 = $ 10. Show how the budget line changes.
As Konrad indicated, there is a typo in the question. But if you set P1=20, the graders will pick it up and grade correctly.
Here, we get 10 units of Good 1 which is like getting an additional 100$. That is, if I had to buy them, I would pay 10$ per unit. But this ‘free money’ cannot be spent on good 2.
So, suppose we only purchase Good 1. We can pay for 40 units and get another 10 for free. That gives us 50 units of Good 1 and zero of Good 2.
But we can reduce purchases of Good 1 and buy good 2. If we put all the cash into Good 2, we would have 20 units of good 2 but still have 10 units of the free Good 1. But, once we spend our cash, we cannot purchase more of good 2.
The idea is that the budget set has this horizontal section that says we can have 20 of good 2 and anywhere from 0 to 10 units of good 1. It implies that I can take the 10 units for free and then give them away without cost. This is called ‘free disposal’ .

c. (4 points) Suppose, instead, Good 2 can be purchased with a bulk discount. For small quantities of ten or less the price is P2 = $ 10. But if the household buys more than 10 units of this good, the price of these additional units 11, 12, 13 . . . is only P2 = $ 5. Show how the budget line changes.
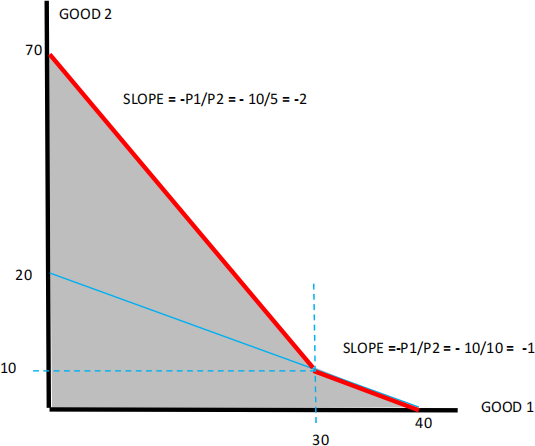
So, suppose we only purchase Good 1. We can pay for 400/10 = 40 units. That gives us 40units of Good 1 and zero of Good 2.
But we can reduce purchases of Good 1 and buy good 2. Suppose we buy exactly 10 units of Good 2 at $10. That costs $100. That would give us (400-100)/10 = 30 units of Good 1 given its price. So the combination of 30 units Good 1 and 10 units Good 2 is feasible.
Now, buy only good 2. We pay $100 for the first 10 units, and with the remaining $300 can buy 300/5 = 60 additional units for a total of 70.
This creates a kink in the budget line so that the top-left has a slope of -2 but the bottom-right has a slope of -1.
TOTAL: 30 points
2023-06-25