BIOL 354 lab
Hello, dear friend, you can consult us at any time if you have any questions, add WeChat: daixieit
Effects of Different Concentrations of Metal Copper or Nickle on the Mung Bean (V. radiata L.) or Winter Wheat Seeds (T. aestivum L.) after 96 Hours Incubation in Observing the Germination
Course Code: BIOL 354 lab
Introduction:
The purpose of this lab was to measure and observe the toxic effects of varying concentrations of copper or nickel on the mung bean or wheat seeds over 96 hours. On the first week of lab procedure, 15 seed samples were placed into each zip bags and with corresponding metal concentrations, and each metal concentration had 2 bags of seeds (30 seeds). After 96 hours incubation in the dark environment, the second part of the experiment, the shoot and root of each seed as long as larger than 2.0 mm was measured and recorded for further experimental determination, and the protruding parts of seeds are the sign of germination (Athar & Ahmad, 2002). Also, the average germination of each seed in different metal concentrations were calculated. At 10°C, it takes 3 to 5 days for wheat seeds to germinate, and mung beans typically germinate within four to five days, but depends on the environment conditions (moisture) as well (Ashraf & Abu‐Shakra, 1978), (Simon, Minchin, McMenamin & Smith, 1976).
Metals are among the most common natural and manmade hazardous pollutants in the environment (Sarma, Deka, Deka & Saikia, 2012). They are persistent in the environment and with the different characteristics of bioaccumulative nature due to their toxicity (Sarma, Deka, Deka & Saikia, 2012). The hazardous impact of specific metals in specific forms and dosages on life is known as metal toxicity (Tchounwou, Yedjou, Patlolla & Sutton, 2012). When some metals combine to produce lethal soluble compounds, they become toxic (Porter, Scheckel, Impellitteri & Ryan, 2004). Even if they are enormously helpful for essential commodities, it also makes them more bioavailable and more likely to be exposed to microorganisms (Tchounwou et al., 2012). Endpoints for toxicity have been defined as growth suppression, enzyme induction, and stress protein production (Kong, Bitton, Koopman & Jung, 1995). Specific enzymatic assays for heavy metal toxicity have been developed (Kong, et. al, 1995). Evaluations of toxicity reduction can be aided by such testing, and Kong et al pointed out that biosensors made of genetically modified microbes may one day allow for the detection of certain metals in the environment (Kong et al., 1995).
Bioaccumulation is a chemical accumulation process that occurs when the rate of absorption outpaces of discharge in an organism (Popek, 2017). Chemicals from the external environment enter the body by contact with soil, water, or air, or through nutritional consumptions (Popek, 2017). Chemicals accumulate and magnify in the tissue and organs of larger animals as polluted smaller species are ingested (Popek, 2017). Animals at the top of the food chain, such as humans, are at danger of collecting high levels of chemicals as a result of the biomagnified food chain, which the contaminant concentrations rise in the tissue of higher-ranking food-chain species (Popek, 2017).
The most common heavy metals that can poison the environment include arsenic (As), cadmium (Cd), chromium (Cr), copper (Cu), nickel (Ni), lead (Pb), and mercury (Hg) (Janssens, Dauwe, Bervoets & Eens, 2001). The manufacturing of pesticides; the chemical industry; untreated sewage sludge; mining; industrial output including foundries, smelters, oil refineries, petrochemical facilities, and pesticide production; traffic, and combustion by-products from coal-burning power plants are all sources of heavy metals, as well as the natural sources of weathering of metal-bearing rocks and volcanic eruptions (Alloway, 2013)(2).
Agriculture involves cultivating the soil, growing crops, and breeding livestock (Fountsop, Ebongue Kedieng Fendji & Atemkeng, 2020). It involves preparing plant and animal items for human consumption and distributing them to marketplaces (Fountsop et al., 2020). Most of the food and textiles in the world are produced through agriculture (Fountsop et al., 2020). Agriculture produces leather, wool, and cotton (Fountsop et al., 2020). Wood for building and paper goods are also produced by agriculture (Fountsop et al., 2020). Common toxic effects on plants by heavy metals include poor biomass accumulation, chlorosis, restriction of growth and photosynthesis, altered water balance and nutrient absorption, and senescence, which eventually results in plant death (Okereafor et al., 2020). If the heavy metals continue spreading through the agricultural plants, it impacts the crops harvest, which it would cause negative effects on food supply for both humans and livestock, as well as it would affect the ecosystem environment and biomagnify contaminants to the upper food chain species (Popek, 2017).
Germination bioassays are commonly used to examine plant waste products for harmful chemicals like phenolic compounds or excessive salt (Gariglio et al., 2002). Also, regarding the availability of medicinal plants, feed for livestock grazing, and food security, seed germination affects the continual plant production essential for human life. Some plants can only be reproduced by seed, and if those seeds are challenging to germinate, it poses a threat to the plants' long-term survival (Bewley, 1997).
Additionally, while wheat seed has more lutein and zeaxanthin than mung bean, mung bean has a higher beta-carotene content. Niacin and riboflavin are more abundant in wheat seeds, whereas pantothenic acid, vitamin B6, and folate are more abundant in mung beans (Hussain, Burhanuddinand & Bhuiyan, 2010). Mycorrhizae, cellular exudates, plasma membrane, heat shock proteins, phytochelatins (PCs), metallothioneins (MTs), organic acids, and amino acids are some of the defensive mechanisms against heavy metal stress in plants (Emamverdian, et. al, 2015). Moreover, by acidifying the rhizosphere, pumping protons through plasma membrane-localized proton pumps, and releasing low-molecular-weight (LMW) chemicals that serve as metal chelators, plants can increase the availability of metal ions for absorption (Jan & Parray, 2016).
Materials and Methods
Please refer to Department of Biology, 2022, Biology 354 Environmental Toxicology 1 Manual, Experiment 3: Effects of Heavy Metals on Seed Germination, pp. 29-37. There are deviations occurred during the experiment, which the measurement used by ruler with one decimal (0.1) place, and the measurement of roots and shoots may not be accurate since this paper was assigned to do the mung bean and some of the shoots bended against on the shaft that were hard to measure the actual lengths. The approximate lengths of the most shoot and root values were obtained (Department of Biology, 2022).
Results:
This paper was assigned to do the mung bean seeds with different concentrations of metal copper affections.
Table 1. Mung Bean and Wheat Seeds Germination Affected by Lead in Various Concentrations, and Their % Germination and Inhibition Values over 96 Hours.
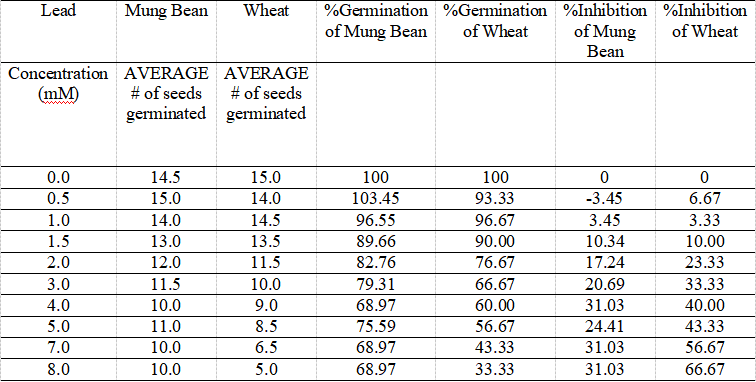
The table indicates the data of average number of each mung bean and wheat seeds affected by different concentrations of metal lead resulting in different germinations, as well as their calculated percentage of germination and inhibition.
Sample calculation:
The seed with 0.0 mM concentration is the control group since they are not affected by the metal.
%Germination of Mung Bean: ![]() x 100% = 103.45%
x 100% = 103.45%
%Inhibition of Mung Bean: 100% - 103.45% = -3.45%
Table 2. Mung Bean and Wheat Seeds Germination Affected by Nickel in Various Concentrations, and Their % Germination and Inhibition Values over 96 Hours.
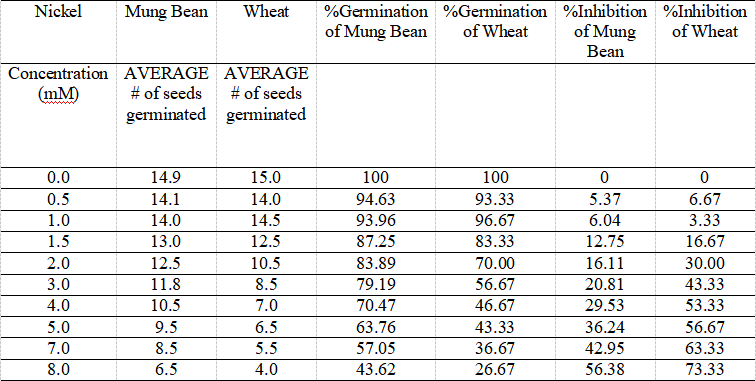
The table illustrates the data of average number of each mung bean and wheat seeds affected by different concentrations of metal nickel resulting in different germinations, as well as their calculated percentage of germination and inhibition.
Sample calculation:
The seed with 0.0 mM concentration is the control group since they are not affected by the metal.
%Germination of Mung Bean: ![]() x 100% = 94.63%
x 100% = 94.63%
%Inhibition of Mung Bean: 100% - 94.63% = 5.37%
Table 3. Mung Bean and Wheat Seeds Germination Affected by Copper in Various Concentrations, and Their % Germination and Inhibition Values over 96 Hours.
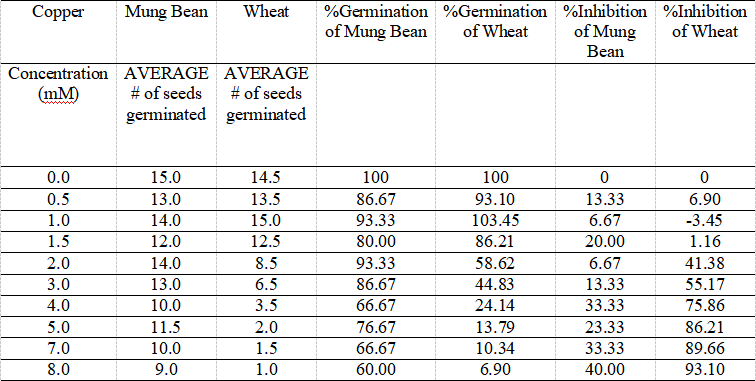
The table shows the data of average number of each mung bean and wheat seeds affected by different concentrations of metal copper resulting in different germinations, as well as their calculated percentage of germination and inhibition.
Sample calculation:
The seed with 0.0 mM concentration is the control group since they are not affected by the metal.
%Germination of Mung Bean: ![]() x 100% = 86.67%
x 100% = 86.67%
%Inhibition of Mung Bean: 100% - 86.67% = 13.33%
Table 4. The Raw Data of Mung Bean Root and Shoot Lengths Measured in Each Metal Copper Concentration.
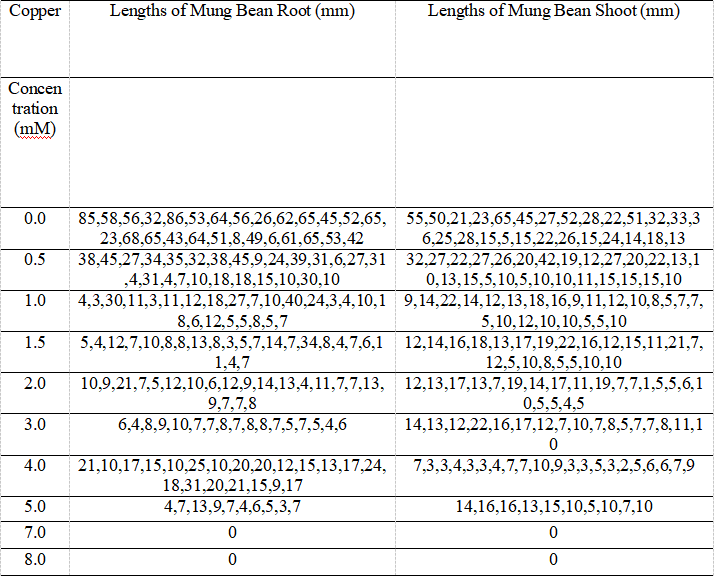
The table presents the raw data of mung bean root and shoot lengths obtained from the lab in different metal copper concentrations.
Table 5. Average Root and Shoot Lengths of Mung Bean at the Various Metal Concentrations for Copper.
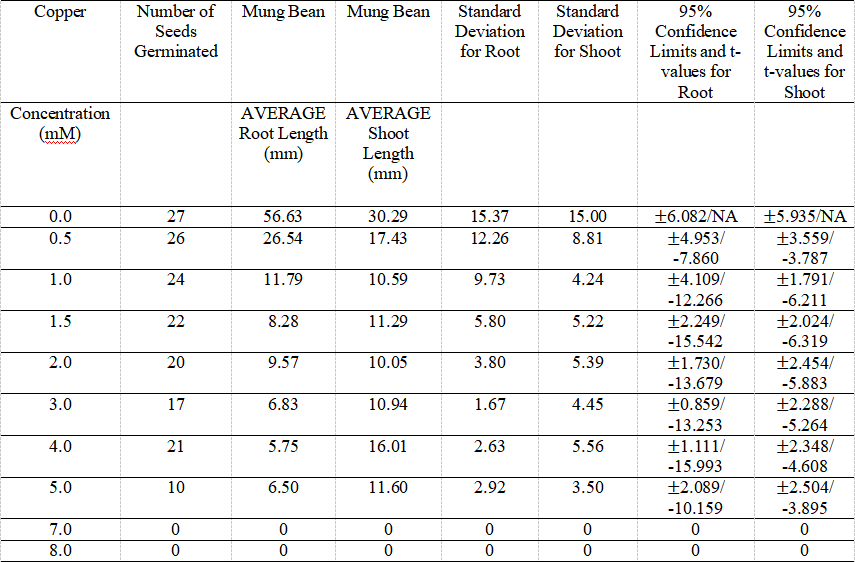
The table presents the data of the average root and shoot length of mung bean seeds, as well as its root and shoot standard deviation and 95% C.I. and t-values in each metal concentration. The number of germinated seeds listed on the second row of the table.
Sample calculation:
Standard deviation for root of mung bean seed at 0.0mM copper:
S.D.=![]() =
=![]() =19.54
=19.54
Same method applied for calculating the S.D. of shoot for the mung bean seeds.
N=27, degrees of freedom = N-1 = 27-1=26
According to the table provided on LEARN, Z=2.056
95% C.L. = ![]() = 56.63
= 56.63 ![]()
![]() = 56.63
= 56.63![]() 6.082
6.082
t-test value for root of mung bean seed at 0.5 mM copper:
Sp = ![]() =
= ![]() = 13.933
= 13.933
t-value = ![]() =
= ![]() = -7.860
= -7.860
Due to p-value < ![]() , the null hypothesis is rejected, which the metal affects the germination of seeds.
, the null hypothesis is rejected, which the metal affects the germination of seeds.
Table 6. The Raw Data of Wheat Root and Shoot Lengths Measured in Each Metal Copper Concentration.
|
Copper |
Lengths of Wheat Root (mm) |
Lengths of Wheat Shoot (mm) |
|
Concentration (mM) |
|
|
|
0.0 |
62,14,42,70,77,24,72,80,79,31,71,76,45,44,51,37,49,62,48,52,43,46,47,36,39,59 |
60,50,60,74,67,12,60,70,70,12,50,55,61,58,65,67,62,54,68,71,59,64,66,58,71,72 |
|
0.5 |
42,47,39,6,67,60,31,37,28,35,42.5,40.5,28,24,37,32,33,29,31,29,34,23 |
40,39,40,5,65,63,30,27,31,36,30,27,45,47,41,32,28,39,42,37,41,51 |
|
1.0 |
15,16,21,47,45,20,31,34,23,20,26,30,39,42,44,35,41.5,43,32,39,35,41,32 |
39,27,40,45,67,30,30,14,20,40,80,37,28,31,37,24,29,35,33,31,28,29,47 |
|
1.5 |
15,10,25,20,20,30,20,20,20,36,25,20,17,19,23,28,25,21,31 |
16,20,22,15,5,35,20,20,17,27,24,20,15,17,20,24,23,21,24 |
|
2.0 |
25,10,20,35,15,5,10,20,25,18,30,26,23,17,25,23 |
30,30,15,10,40,20,15,20,20,20,18,10,15,9,11,15 |
|
3.0 |
10,14,12,13 |
20,8,36 |
|
4.0 |
10 |
9 |
|
5.0 |
15,5,17 |
12,8 |
|
7.0 |
0 |
0 |
|
8.0 |
0 |
0 |
The table presents the raw data of wheat root and shoot lengths obtained from the lab in different metal copper concentrations.
Table 7. Average Root and Shoot Lengths of Wheat at the Various Metal Concentrations for Copper.
|
Copper |
Number of Seeds Germinated |
Wheat |
Wheat |
Standard Deviation for Root |
Standard Deviation for Shoot |
95% Confidence Limits and t-values for Root |
95% Confidence Limits and t-values for Shoot |
|
Concentration (mM) |
|
AVERAGE Root Length (mm) |
AVERAGE Shoot Length (mm) |
|
|
|
|
|
0.0 |
26 |
61.31 |
49.92 |
16.53 |
15.14 |
|
|
|
0.5 |
22 |
39.91 |
33.32 |
12.00 |
12.35 |
-5.047 |
-3.88 |
|
1.0 |
23 |
29.57 |
38.80 |
8.83 |
13.46 |
-8.158 |
-2.670 |
|
1.5 |
18 |
20.44 |
21.06 |
4.46 |
6.59 |
-10.202 |
-2.922 |
|
2.0 |
16 |
16.31 |
22.75 |
7.60 |
7.38 |
-10.209 |
-2.780 |
|
3.0 |
2 |
23 |
17 |
18.38 |
4.24 |
-3.144 |
-3.017 |
|
4.0 |
1 |
9 |
10 |
/ |
/ |
/ |
/ |
|
5.0 |
2 |
10 |
7.07 |
10 |
2.83 |
-4.283 |
-3.931 |
|
7.0 |
0 |
0 |
0 |
0 |
0 |
0/0 |
0 |
|
8.0 |
0 |
0 |
0 |
0 |
0 |
0/0 |
0 |
The table presents the data of the average root and shoot length of wheat seeds, as well as its root and shoot standard deviation and 95% C.I. and t-values in each metal concentration. The number of germinated seeds listed on the second row of the table.
Sample calculation:
Standard deviation for root of wheat seed at 0.0mM:
S.D.=![]() =
=![]() =16.53
=16.53
Same method applied for calculating the S.D. of shoot for the wheat seeds.
95% C.L. for 0.0 mM wheat root:
N=26, degrees of freedom = N-1 = 26-1=25
According to the table provided on LEARN, t-value=2.060
95% C.L. = ![]() = 61.31
= 61.31 ![]()
![]() = 61.31
= 61.31![]() 6.678
6.678
t-test value for root of wheat seed at 0.5 mM copper:
Sp = ![]() =
= ![]() = 19.469
= 19.469
t-value = ![]() =
= ![]() = -5.047
= -5.047
Due to p-value < ![]() , the null hypothesis is rejected, which the metal affects the germination of seeds.
, the null hypothesis is rejected, which the metal affects the germination of seeds.
Figure 1. Percentage Inhibition of Germination of Mung Bean Seed at 96hrs for Different Concentrations of Metal Nickel, Copper, and Lead.

The graph shows the liner relationship between the percentage inhibition of germination of mung bean seed at 96hrs with different metal affection concentrations, nickel, copper, and lead, as well as each metal’s derived EC50 concentration.
Figure 2. Percentage Inhibition of Germination of Wheat Seed at 96hrs for Different Concentrations of Metal Nickel, Copper, and Lead.

The graph shows the liner relationship between the percentage inhibition of germination of wheat seed at 96hrs with different metal affection concentrations, nickel, copper, and lead, as well as each metal’s derived EC50 concentration.
2023-06-24