ECON 341 International Trade (Exam) 2021
Hello, dear friend, you can consult us at any time if you have any questions, add WeChat: daixieit
ECON 341
International Trade
(Exam) 2021
1 The figure gives the Home country’s PPF for goods X and Y, indifference curves , price line PA associated with production equilibrium A and consumption equilibrium T and price line PB associated with production equilibrium B and consumption equilibrium S . Point C captures the autarky equilibrium where production and consumption at Home are equal. Suppose that Home has a comparative advantage in good X .

The move to point S from point C captures
Select one alternative:
welfare loss from trade.
gains from trade.
producer surplus gain.
consumer surplus loss .
2 The figure gives the Home country’s PPF for goods X and Y, indifference curves , price line PA associated with production equilibrium A and consumption equilibrium T and price line PB associated with production equilibrium B and consumption equilibrium S . Point C captures the autarky equilibrium where production and consumption at Home are equal. Suppose that Home has a comparative advantage in good X .
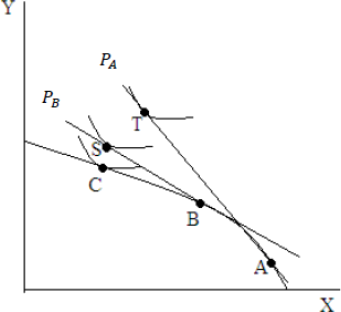
The move from point C to point B captures
Select one alternative:
specialization resulting from a move to trade.
producer surplus loss .
consumer surplus gain.
None of the options is correct.
3 The figure gives the Home country’s PPF for goods X and Y, indifference curves , price line PA associated with production equilibrium A and consumption equilibrium T and price line PB associated with production equilibrium B and consumption equilibrium S . Point C captures the autarky equilibrium where production and consumption at Home are equal. Suppose that Home has a comparative advantage in good X .

The pivot of the price line PB to PA is called
Select one alternative:
terms of trade loss .
reduction in the optimal tariff.
shift in the PPF.
terms of trade gain.
4 Suppose that there are two industries in New Zealand, manufacturing and agriculture. Capital is fixed in manufacturing, land in agriculture and labour is mobile between the two sectors . Suppose that the price of manufacturing decreases due to trade. Consider the following data and answer the question.
Manufacturing:
Sales revenue = ![]() = 100
= 100
Payments to labour = ![]() = 60
= 60
Payments to capital = ![]() = 40
= 40
Percentage decrease in the price = ![]() = - 20% (negative twenty percent)
= - 20% (negative twenty percent)
Agriculture:
Sales revenue = ![]() = 100
= 100
Payments to labour = ![]() = 50
= 50
Payments to land= ![]() = 50
= 50
Percentage decrease in the price = ![]() = 0%
= 0%
![]()
![]() We know that
We know that ![]()
![]()
![]()
![]()
![]()
. Suppose that ![]()
is equal to - 5% (negative five percent). Then, ![]() is
is
Select one alternative:
![]() - 42.5%
- 42.5%
![]() 42.5%
42.5%
![]() 25%
25%
![]() - 25%
- 25%![]()
![]()
![]()
![]()
![]()
![]()
5 Suppose that there are two industries in New Zealand, manufacturing and agriculture. Capital is fixed in manufacturing, land in agriculture and labour is mobile between the two sectors . Suppose that the price of manufacturing decreases due to trade. Consider the following data and answer the question.
Manufacturing:
Sales revenue = ![]() = 100
= 100
Payments to labour = ![]() = 60
= 60
Payments to capital = ![]() = 40
= 40
Percentage decrease in the price = ![]() = - 20% (negative twenty percent)
= - 20% (negative twenty percent)
Agriculture:
Sales revenue = ![]() = 100
= 100
Payments to labour = ![]() = 50
= 50
Payments to land= ![]() = 50
= 50
Percentage decrease in the price = ![]() = 0%
= 0%
![]()
![]() We know that
We know that ![]()
![]()
![]()
![]()
![]()
. Suppose that ![]()
is equal to - 5% (negative five percent). The result that capital loses by more than the decrease in the price of manufacturing is called
Select one alternative:
![]() the Heckscher-O hlin theorem .
the Heckscher-O hlin theorem .
![]() the magnification effect.
the magnification effect.
![]() the Rybczynski theorem .
the Rybczynski theorem .
![]() the Ricardian principle of comparative advantage.
the Ricardian principle of comparative advantage.
6
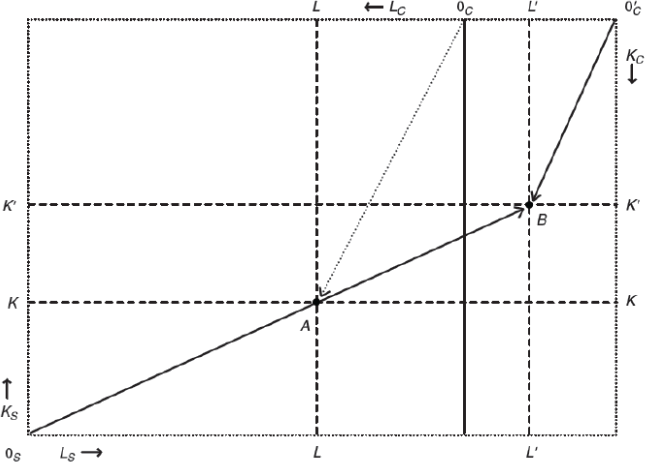
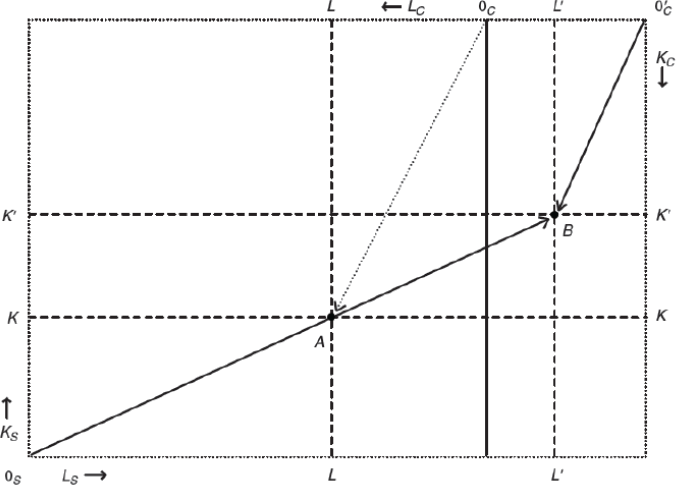
Suppose that China has two sectors , Computers and Shoes . Computers is capital intensive and Shoes is labour intensive. In the following diagram , OS and OC represent the origins for Shoes and Computers respectively. The lengths of the horizontal and vertical axes represent the total endowment of labour and capital. A represents the initial equilibrium in the economy, showing the allocation of capital and labour between Computers and Shoes .
The capital-labour ratio in Computers in China is given by
Select one alternative:
7 Suppose that China has two sectors , Computers and Shoes . Computers is capital intensive and Shoes is labour intensive. In the following diagram , ![]() and
and ![]() represent the origins for Shoes and Computers respectively. The lengths of the horizontal and vertical axes represent the total endowment of labour and capital. A represents the initial equilibrium in the economy, showing the allocation of capital and labour between Computers and Shoes .
represent the origins for Shoes and Computers respectively. The lengths of the horizontal and vertical axes represent the total endowment of labour and capital. A represents the initial equilibrium in the economy, showing the allocation of capital and labour between Computers and Shoes .

Now suppose that there is an inflow of migrants from Myanmar into China. This is captured by a shift in the origin for Computers from ![]() to
to ![]() .
.
With the inflow of migrants into China, the capital-labour ratio in Computers is given by
Select one alternative:
8 Suppose that China has two sectors , Computers and Shoes . Computers is capital intensive and Shoes is labour intensive. In the following diagram , ![]() and
and ![]() represent the origins for Shoes and Computers respectively. The lengths of the horizontal and vertical axes represent the total endowment of labour and capital. A represents the initial equilibrium in the economy, showing the allocation of capital and labour between Computers and Shoes .
represent the origins for Shoes and Computers respectively. The lengths of the horizontal and vertical axes represent the total endowment of labour and capital. A represents the initial equilibrium in the economy, showing the allocation of capital and labour between Computers and Shoes .

Now suppose that there is an inflow of migrants from Myanmar into China. This is captured by a shift in the origin for Computers from ![]() to
to ![]() .
.
The inflow of migrants into China results in
Select one alternative:
![]() the capital-labour ratio in Computers and Shoes remaining unchanged.
the capital-labour ratio in Computers and Shoes remaining unchanged.
![]() a decrease in the capital-labour ratio in Shoes .
a decrease in the capital-labour ratio in Shoes .
![]() an increase in the capital-labour ratio in Computers .
an increase in the capital-labour ratio in Computers .
![]() a decrease in the capital-labour ratio in shoes but an increase in Computers .
a decrease in the capital-labour ratio in shoes but an increase in Computers .
9 Suppose that China has two sectors , Computers and Shoes . Computers is capital intensive and Shoes is labour intensive. In the following diagram , ![]() and
and ![]() represent the origins for Shoes and Computers respectively. The lengths of the horizontal and vertical axes represent the total endowment of labour and capital. A represents the initial equilibrium in the economy, showing the allocation of capital and labour between Computers and Shoes .
represent the origins for Shoes and Computers respectively. The lengths of the horizontal and vertical axes represent the total endowment of labour and capital. A represents the initial equilibrium in the economy, showing the allocation of capital and labour between Computers and Shoes .
Now suppose that there is an inflow of migrants from Myanmar into China. This is captured by a shift in the origin for Computers from ![]() to
to ![]() .
.
The inflow of migrants into China results in
Select one alternative:
![]() an increase in the wage and rental rate of capital in China.
an increase in the wage and rental rate of capital in China.
![]() a decrease in the wage and rental rate of capital in China.
a decrease in the wage and rental rate of capital in China.
![]() no change in the wage and rental rate of capital in China.
no change in the wage and rental rate of capital in China.
![]() a decrease in the wage and an increase in the rental rate of capital in China.
a decrease in the wage and an increase in the rental rate of capital in China.
10 Suppose that China has two sectors , Computers and Shoes . Computers is capital intensive and Shoes is labour intensive. In the following diagram , ![]() and
and ![]() represent the origins for Shoes and Computers respectively. The lengths of the horizontal and vertical axes represent the total endowment of labour and capital. A represents the initial equilibrium in the economy, showing the allocation of capital and labour between Computers and Shoes .
represent the origins for Shoes and Computers respectively. The lengths of the horizontal and vertical axes represent the total endowment of labour and capital. A represents the initial equilibrium in the economy, showing the allocation of capital and labour between Computers and Shoes .

Now suppose that there is an inflow of migrants from Myanmar into China. This is captured by a shift in the origin for Computers from ![]() to
to ![]() .
.
The inflow of migrants into China results in
Select one alternative:
![]() None of these options is correct.
None of these options is correct.
![]() a decrease in the output of Shoes in China.
a decrease in the output of Shoes in China.
![]() an increase in the output of Computers in China.
an increase in the output of Computers in China.
![]() an increase in the output of Shoes in China.
an increase in the output of Shoes in China.
11 See the attached PDF below for short answer questions comprising Section B of the ECON 341 final exam .
Please download the file and read instructions carefully before you answer.
Note that Section A consists of M ultiple Choice Q uestions that should be completed online.
For Section B , please write or type your answers to the questions . O nce you are ready to submit, upload your answers here in a single pdf answer file. For written work , you must take a good quality photo or scan of your answer file. If you take a photo, ensure appropriate lighting and exposure so that answers are clear and readable. Please make sure diagrams and equations are clear, labeled and legible.
2023-06-21