Module 5: Protein Separation via Size Exclusion Column Chromatography S23
Hello, dear friend, you can consult us at any time if you have any questions, add WeChat: daixieit
Module 5: Protein Separation via Size Exclusion Column Chromatography
REPORT
Include in the following order:
- Results (raw data, table, plots)
- Answers to Questions
- Summary (objective, at least one thing that you learned, and what advice you would offer to another student doing the experiment)
**Please be aware that the estimated grade allocations for each question has been offered as a guide and may be subject to change.**
Results:
Your results section should include…
A. (3 marks) Size Exclusion Chromatography (SEC):
1. Clear, readable photo of SEC Results with column dimensions (including any calculations if required) signed by a TA
2. Plot a SEC Chromatogram of your results by plotting the Abs on the y-axis and fraction (or tube) number on the x-axis. On this one graph plot both the Abs280 and Abs410 values for each tube. Use a Scatter plot with a smoothed line to represent the absorbance trend seen at each wavelength. Include the following:
- a proper title and axis labels/titles with appropriate units
- a legend indicating which line for which wavelength
- text box within the plot indicating which fractions had colour and which were positive for catalase activity
- underneath the plot, a statement that informs the reader of the fractions that were further
analyzed by SDS-PAGE and Bradford Assay.
**Be sure to follow the graphing guidelines provided on LEARN "Graphing Data.pdf".
B. (7 marks) SDS-PAGE:
1. Include a copy of your SDS-PAGE
- annotate electrodes
- include a legend – clarify what each lane contains with reference to the fraction number)
- assign and label the bands observed in the MW standards lane.
A list of the proteins present in the standard mix is presented below.
|
SDS-PAGE Protein Standard contains the following proteins: • Phosphorylase b (97 kDa) • Bovine serum albumin (66 kDa) • Ovalbumin (45 kDa) • Carbonic anhydrase (30 kDa) • Soybean trypsin inhibitor (20.1 kDa) • α-Lactalbumin (14.4 kDa) |
2. Determine the distances travelled and Rf values for each MW standard band and the main bands representing catalase and myoglobin. Use the indicated start line and the Blue dye marker line for the end (“front”) line. Show your distance measurements directly on the submitted photo. (see note on LEARN for how to analyze your gel and calculate Rf values).
3. Provide a table with the following information:
o Protein Name
o Distance migrated
o Rf value
o Molecular weight (MW) in kDa units
o Log (MW)
Fill in the table with the SDS-PAGE results for the MW Standard Proteins as well as the measurements for the Catalase and Myoglobin samples. DO NOT INCLUDE molecular weight values for the Catalase and Myoglobin samples. These values will be determined in the next step.
4. Plot a calibration curve (properly titled) by plotting the log MW of the standard proteins (y- axis) vs. Rf (x-axis) and then underneath the plot, use the equation of the line to determine the
average molecular weight of the two proteins of interest (myoglobin and catalase) from their Rf values. Show your calculations. For more help, refer to the respective topic in the experiment module located on LEARN.
NOTE: This Calibration Curve is actually “the best fit line” (DO NOT draw a non-linear curve nor connect the dots). Plot your data on Excel as a scatter plot and then use a trendline (or LINEST, etc.) for a linear regression of your data. Make sure to include the equation of the line and R2 value. **DO NOT force the line through the origin.
Questions:
Q1. (2 marks) (a) Indicate the measurement of your resin bed as recorded in the lab.
(b) From the measured dimensions of your column, calculate the bed volume (mL).
(c) When should you expect the catalase and myoglobin to elute from the column relative to the bed volume ? Choose on of the following outcomes and explain your reasoning:
- both should elute before bed volume is collected
- both should elute after bed volume is collected
- one should elute before and one after bed volume is collected
Q2. (3 marks) (a) Define “void volume”?
(b) Use the measured dimensions of your column to determine approximate void volume.
(c) When should you expect the catalase and myoglobin to elute from the column relative to the void volume? Choose one of the following and explain your reasoning:
- both should elute before void volume is collected
- one should elute at the same time as void and the other after void volume is collected
- one should elute at the same time as void and the other before void volume is collected
Q3. (2 marks) Compare your chromatography results to your expectations as responded in Q#1 and #2. Do they agree? What is your proof?
Q4. (2 marks) Research the properties of Myoglobin:
Go to theUniProtdatabase and search for “myoglobin AND horse”. Click on the Search button.
• Click on the "P68082" Entry
• Browse through the page/s that follows. It will offer information on the structural/functional features of the protein as well as references. You will see key headings on the left of the webpage, find and click the “Sequence” heading. There you will see the amino acid sequence of myoglobin.
• In the Sequence section, there will be a menu bar at the top. Click the “Tools” downward arrow and select “ProtParam”.
• You will see that this tool allows you to investigate different parts of the protein.
• We want to analyze the full-length polypeptide chain therefore click on … FT CHAIN 2-
154 Myoglobin.
• The next page will show many different calculated/determined properties for the protein including the amino acid sequence, the molecular weight, pI, amino acid composition, etc.
(a) Record the molecular weight and theoretical pI value of myoglobin
(b) Under the amino acid composition table find and record the number of tyrosine and tryptophan residues found in myoglobin. Calculate the molar extinction coefficient for myoglobin at 280nm in units of M(subunit)- 1cm-1 . Remember: tyrosine ε280nm = 1490 M- 1 cm- 1 and tryptophan ε280nm = 5500 M- 1 cm- 1
**Helpful Tip: Please refer to the introduction section for how to proceed with this calculation
Q5. (3 marks) In the same manner as you did for Myoglobin above, search “Catalase AND bovine” in the sameUniProtdatabase and then click on the "P00432" entry. Find the sequence section and then query “ProtParam” in the dropdown menu box. Click on the full sequence “2 – 527” to analyze the full amino acid composition of a monomer subunit.
(a) Record the molecular weight and theoretical pI value of catalase (monomer subunit)
(b) Under the amino acid composition table find and record the number of tyrosine and tryptophan residues found in a subunit of catalase and calculate the molar extinction coefficient at 280nm in units of M(subunit)- 1cm-1 .
(c) Since we know that the native structure of catalase is a tetramer, use the molar extinction coefficient as determined in part (b) to calculate that of a catalase tetramer.
Q6. (6 marks) Now that you have calculated the molar extinction coefficients of myoglobin and catalase, you can use them to determine the protein concentration of your highest myoglobin-containing fraction and your highest catalase containing fraction.
Step #1: Record the absorbance reading of each of the highest containing catalase and myoglobin fraction at 280 nm
Step #2: Determine the corrected absorbance value for the fraction of each protein above: To do this subtract the average baseline absorbance (make sure you indicate what this value is and how you arrived at it) from the above chosen values.
(Helpful Tip: Your baseline absorbance should be an average of a stable baseline seen prior to the elution of the first protein peak - you should be subtracting the same baseline value from both catalase and myoglobin).
Step #3: For the two corrected absorbance values calculated above, use the Beer-Lambert equation to determine the molar concentration of each catalase and myoglobin (using their respective calculated ε280nm ). Assume that you used a cuvette with a 1.0 cm pathlength. (Show your calculations)
Step #4: Once you determine the concentration of each protein in the cuvette, factor in the dilution made (100 µL of the fraction added to 1000 µL of buffer) prior to reading the absorbance value of the fraction. Determine the molar concentration of each protein in their respective fraction collected from the column chromatography.(show your calculations)
Step #5: Use the calculated MW from that recorded from the ProtParam database to convert the molar concentration for the catalase and myoglobin to their respective concentrations in units of "mg/mL". (Show your calculations)
Step #6: Consider the volume of the fraction collected for the highest containing catalase and myoglobin fraction and determine the "mg" amount recovered in them, respectively
Step #7: Fill in the table below with the results determined above:
|
Step |
Peak Catalase fraction |
Peak Myoglobin fraction |
|
Abs280 |
|
|
|
Baseline Abs280 |
|
|
|
Corrected Abs280 |
|
|
|
|
|
|
|
[Protein] in cuvette |
|
|
|
[Protein] in collected fraction (M) |
|
|
|
MW |
|
|
|
[Protein] in collected fraction (mg/mL) |
|
|
|
amount of protein recovered (mg) |
|
|
Q7. (3 marks) Analyze Recovery:
(a) Compare the “mg” amount of catalase and myoglobin recovered (as calculated in Q#6) with the respective “mg” amount that was applied onto the column to start. Calculate the % recovery.
(b) In this experiment we expect a recovery of less than 50% because only one fraction of each protein was retained. Explain what problem could arise if we decided to retain and pool three of the highest catalase-containing fractions and then three of the highest myoglobin-containing fractions - instead of only one of each, like we did in the lab.
Q8. (1 mark) Use your SDS-PAGE results to qualitatively analyze how well size exclusion chromatography separated the two proteins: Compare your results to what you see in the lane containing the original protein mixture. Were the two proteins successfully separated? What would you see if the two proteins weren’t successfully separated via the size exclusion chromatography?
Q9. (2 marks)
(a) State the experimental molecular weights of catalase and myoglobin, determined from SDS- PAGE (Results: B-4)
(b) How do these values compare with the MW values obtained from the ProtParam database? Comment on the % error and show your calculations.
(c) Why is the MW of Catalase, as determined by SDS-PAGE, approximately ¼ of the native molecular weight as stated in the introduction?
Q10. (5 marks) A grad student is investigating the inter-subunit interactions within a red fluorescent protein that exists naturally as a homodimer (wtRFP). The MW of the homodimer wtRFP is 60 kDa. As part of her research, she introduces a non-conservative mutation in the RFP that is presumed to disrupt the inter-subunit interactions within the dimer. She overexpresses and isolates the mutated RFP (mRFP) via hydrophobic interaction column chromatography. To see whether the introduced mutation has an effect on the quaternary structure of the mRFP, her supervisor asks her to use size exclusion column chromatography. The following presents choices that the grad student must make for her investigation. For each, indicate which choice is better and why:
(a) What would be the best fractionation range to use? (i) 3 - 60 kDa or (ii) 60 – 120 kDa
(b) Sample size is an important factor when separating proteins via SEC. The mRFP sample is 0.25 mL. What size column should she use? (i) 1 cm x 10 cm or (ii) 1 cm x 50 cm
(c) With the column size chosen above, at what volume should she expect the mRFP to elute if the mutation (i) disrupts the inter-subunit interactions or (ii) does not disrupt the inter-subunit interactions?
(d) Instead of size exclusion column chromatography, the student thinks she can just run an SDS-PAGE. She decides to test both the isolated mRFP and the wtRFP by SDS-PAGE (reducing conditions).
Do you think the information she gets from this would be helpful? Explain. (Note: Assume the mutation does not significantly affect the molecular weight of RFP’s primary structure).
(e) What does “reducing conditions” mean for SDS-PAGE?
Q11. (5 marks) A mixture containing four proteins with native (not denatured) molecular weights: 240 kDa, 120 kDa, 60 kDa and 20 kDa were applied on a size exclusion chromatography column (1.0 cm (i.d.) x 80 cm) with a fractionation range of 25 – 100 kDa. The chromatography was kept under native conditions. Answer the following:
(a) Calculate the bed and approximate void volume for this column.
(b) Sketch (can be a hand drawn image) a chromatogram representing the separation of this mixture of proteins with the above-mentioned size exclusion column. Label the y-axis “arbitrary absorbance at 280nm” and the x-axis “volume of elution” . Have the x-axis with tick marks at 10, 20, 30, 40, 50, 60 and 70 mL of elution volume. Label the contents of each peak.
(c) Briefly discuss your reasoning for your expected elution profile in part (b).
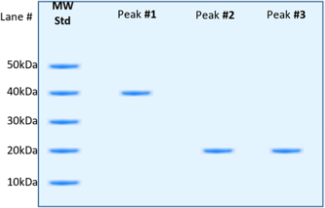
(d) The three separated peaks that eluted from the column (viewed by chromatogram) were collected and analyzed by SDS-PAGE under reducing conditions, and then stained with Coomassie Blue. The results are shown below. Describe what you are seeing in each lane (Peak #1 through #3). For each peak, describe how each band and its respective MW is related to the expected protein content.
Summary: (1 mark) Briefly, the objective, what you learned from this experiment and what advice you would offer to another student doing the experiment.
Overall Impression: (1 mark)
2023-06-20