Module 5: Protein Separation via Size Exclusion Column Chromatography W23
Hello, dear friend, you can consult us at any time if you have any questions, add WeChat: daixieit
Module 5: Protein Separation via Size Exclusion Column Chromatography
PROCEDURE:
For this experiment you will be using size exclusion column chromatography to separate two proteins. The separation will be assessed by UV/Vis Spectrophotometric analysis, reactivity and SDS-PAGE.
Required Reagents and Supplies:
- 50mM phosphate buffer pH 7.0
- 30% hydrogen peroxide (return at the end of the lab)
- chromatography column filled with Bio-Gel P-60 (_____ cm x _____ cm)
- microfuge tube containing 250 µL of protein mixture that is ____mg/mL myoglobin and _____mg/mL catalase.
- sheet of Bench Plastic Coated paper
- disposable PMMA cuvettes 1.5 ml (make sure you ONLY use one)
- clean empty microfuge tubes
- 2 microfuge tubes containing 20µl of 5X SDS-PAGE sample loading dye
Part A: Size Exclusion/Gel Filtration Chromatography
1. Measure the length of your size exclusion column. Make sure to measure from the top part of the resin to the bottom. The inner diameter (i.d.) of the column is 1.0 cm.
length = _______; internal diameter (i.d.) = 1.0 cm
2. Using a disposable Pasteur pipette, gently remove the buffer above the column bed. Leave about 3 or 4 mm of buffer above the bed top. See drawings below (tube A).
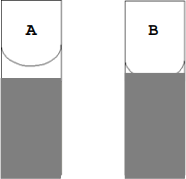
3. Turn the stopcock to the open position and allow the buffer to drain through the column until the bottom of the meniscus just touches the top of the resin bed (tube B). Drain eluate into a 100 mL beaker labeled “waste” . Stop the flow of the column by turning the stopcock to the closed position.
4. Label microfuge tubes #1-20.
5. Apply the entire sample of protein mixture on to the resin: To do this, use the yellow micropipettor (set at 100 µL) to gently transfer the protein mixture drop by drop onto the top of the resin surface. Repeat the transferring until the entire sample is applied onto the resin.
6. Place the elution (exit) tubing over microfuge tube #1, ready for collection. Restart the flow of the column and allow the sample to enter the column bed. At the same time, you should start collecting the eluted volume into the microfuge tube #1.
7. Once the meniscus reaches the column bed surface (like above figure “B”) turn the stopcock to the closed position. Gently add a small volume of buffer (about 200 µL using the same pipette but new tip) to the top of the resin. Make sure not to disturb the resin surface – this will help keep a “tight” band of protein… better resolution. Allow this to enter the column bed. Repeat this 2 times. You should start to see the reddish protein band moving downward and the surface of the resin returning to its white colour.
In the meantime, keep a second eye on your collection tube. Once the volume in your collection tube has reached about 0.5 mL, switch to microfuge tube #2. The tubes have volume graduations in the side.
8. Now start filling the reservoir above the resin, very gently at first with a disposable pipette. Once there is ~5 cm of buffer above the resin bed, you can add the buffer more quickly. Make sure that you do not disturb the top of the resin.
9. Continue to collect the volume being eluted from the column in microfuge tubes, making sure to change tube once ~0.5 mL has been collected per tube. Proceed until you see the reddish myoglobin band coming off the column.
Collect at least 3 colourless fractions after the last red fraction is collected. If you find that you are running out of collection tubes, please get more.
10. Make sure that the column does not run dry while collecting fractions.
11. Make sure to note any fractions that are not ~0.5 mL, for example if you notice that you’re collecting fraction volumes closer to 0.4 mL or 0.6 mL rather than 0.5 mL. You will need to know when writing up your report.
Part B: Detecting the presence of Myoglobin and Catalase Activity (Can be done while collecting fractions)
Colour:
The first assay is to simply look at the colour of the fractions. The catalase should be v. pale yellow, and the myoglobin is reddish brown. These colours can be difficult to identify – ask a TA if you are unsure. To help visualize it, you can compare the fractions to the sleeve of your lab coat or a piece of paper.
12. Note the color of each fraction in a titled data table in your lab book. Indicate the intensity of the colour by annotating with “+/-“ for a weak colour; “+” for a positive colour and “+++” for a more intense colour.
Catalase Activity:
13. Use the Eppendorf pipettor to spot 20 µL of hydrogen peroxide onto the bench paper, plastic coated (shiny) side up. Start with 12 spots and add more if necessary. Underneath the H2O2 drops, label each with a number 1 through 12 to represent the fractions to be tested.
14. Now add 20 µL of a fraction to its respectively labelled spot of H2O2 . Watch to see if O2 bubbles form in the drop. Continue testing fractions until you see the catalase activity appear and then disappear. There should be 1 or 2 fractions that test positive. Check with a TA if you do not see any reaction for any of your fractions. Note the results of each fraction in the same titled data table in your lab book.
Part C: Analyzing Protein Separation: UV/VIS Spectrophotometric Assay for Protein and Myoglobin (Can be done by one person as the other is collecting fractions)
15. The Cary60 UV/Visible spectrophotometers should be set up as indicated below.
In the Windows screen, click on the Cary WinUV icon. Several applications will appear in a new window. Click on the RNA/DNA application. Press the Setup button and enter in the following settings under the various tabs, then press OK.
|
Menu Tab |
Setting |
|
Cary60 |
Wavelength 1 (nm) = 280 |
|
Wavelength 2 (nm) = 410 |
|
|
Samples |
Number of samples = double the number of fractions (set- up for double the amount of planned reads just in case you need to re-read any) |
|
AutoStore |
Storage On (prompt at start) |
16. Transfer 2 mL of phosphate buffer into a PMMA cuvette (make sure that the cuvette is PMMA- polymethyl methacrylate). This is the blank.
- Wipe the cuvette on the flat sides with a Kimwipe.
- Insert the cuvette into the sample holder of the Cary60 with the top arrow facing your right.
- Click zero to blank the instrument. Then click “OK” to read the blank. Note: this absorbance value for the blank (a value of about 0.3) will be presented in brackets. The “brackets” indicate that the software will be subtracting this value from the following reads. To ensure and confirm that the instrument is “zero’d” properly, click on the “Start” button and you should see that the blank sample has a near zero absorbance at both wavelengths.
- Empty the contents of the cuvette used for the blank. Ensure that there is minimal buffer remaining in the cuvette (tap it up-side-down onto a Kimwipe).
- Click “Start” again to begin the run. You will be prompted for a file name. Enter something that resembles Chem233L followed by your initials.
- You will be prompted to enter each sample at this point.
17. Read absorbance of fractions:
- Pipette 100 µL of the first fraction collected from the column into the same (now empty) cuvette. Next, add 1.000 mL of phosphate buffer into the same cuvette. Seal the top of the cuvette with a small piece of Parafilm and mix the contents by inverting it 2-3 times.
- Wipe the cuvette on the flat sides with a Kimwipe and insert the cuvette into the sample holder with the top arrow on the cuvette facing right.
- Click “Start” .
- Remove the cuvette and empty its contents into a “Waste” beaker.
- If there is no significant absorbance at either wavelength, you may continue with the next
fraction without rinsing in between readings.
- Once you start to see the absorbance value at 280 nm slightly increasing (around fraction #6 or #7), you will need to start rinsing the cuvette in between readings with ~500 µL of Milli-Q water and then empty it (shake it downward) to remove most remaining liquid.
- Repeat the above steps for all the fractions using the same PMMA cuvette in the same orientation.
- Record the data in a titled table in your lab book.
18. Monitor your 280 nm absorbance readings as you progress:
- You should be maintaining a stable baseline of about 0.00XX before the first protein elutes (at around fraction #7).
- In addition, expect very low values. Abs values at 280 nm should never be above 0.0700 throughout the entire collection of fractions. If you see higher values, please consult a TA or the instructor.
19. For Part E you will only need one of each isolated catalase- and myoglobin-containing fraction. Review your data and decide with which of your catalase-containing and myoglobin-containing fractions you would like to continue. Choose the fractions with the most catalase activity and the highest absorbance value at 410 nm.
Part E: SDS-PAGE: Analysis of Protein Purification (can be done by one person as the other is determining the absorbance for each fraction)
20. Take two microfuge tubes each containing 20 μL of 5X Loading Buffer. Label one tube with a “C” (catalase) and the other with an “M” (myoglobin).
Add 80 μL of the highest catalase and highest myoglobin-containing fractions into their respective tubes. Seal the tubes, and heat in a boiling water bath for about 3-5 minutes. Monitor the tubes and if one pops open during the heating, reseal it quickly.
21. Make sure that the boiling water bath does not go dry and turn off the heat as soon as you are finished. Once samples are prepared, the laboratory instructor or TA will demonstrate the use of the Bio-Rad SDS-PAGE system.
|
While the SDS-PAGE run is very quick, the stain/destain stages (which will be done for you) require approximately 24-hours to complete. As a result, you may return one-two days after your laboratory period to view your developed gel. A photo of your gel will be posted on LEARN. Since you will be determining Rf values, you may measure the distances migrated directly from a printout of your gel. Please refer to the related LEARN module for tips on how to analyze your gel. |
WASTE DISPOSAL:
- Buffers and all fractions collected may be disposed of down the drain.
- Leave the tube containing hydrogen peroxide at your bench.
- Once you are sure that the SDS-PAGE of your samples is running properly, you may dispose the SDS- PAGE samples in the designated waste container. This is normally below the whiteboard in ESC 149, in a white bin marked ‘SDS-PAGE WASTE’ .
2023-06-20