Sample 23
Hello, dear friend, you can consult us at any time if you have any questions, add WeChat: daixieit
Question 1 (25pts) Short answer questions.
Answer the questions below with no more than 1 to 2 paragraphs.
1.I.(5 pts) Describe how one could design a simulation to demonstrate why communities of disparate individuals might have a tendency to congregate together over time.
1.II. (5 pts) Susan needs to pick up food orders from different restaurants and deliver them to customers living in different apartments. Describe how one could plan her trip given the locations of the restaurants, the size of the orders and the number of customers in each apartment so that she can make these deliveries in the least amount of time.
1.III. (5 pts) To generate more employment opportunities for workers with only a secondary school education how might a government determine the most "bang for their buck" when deciding on which type of expenditures they should make in a stimulus package?
1.IV (5 pts) A city has determined that each immunisation site they have that can jab up to 350 people a day. Describe how one could design a method to determine the number of sites needed to provide at least 12,000 a day given the probability distribution of the number of people who would arrive at the sites every minute of the day ranges from 0 to 3 with a probability of 1/4.
1.V. (5 pts) A university is planning to cut some subjects taught due to falling enrolments. Given that subjects are prerequisites for other subjects, how could they rank the subjects to minimise the impact on the ability of students to earn their degrees?
Question 2
(a)(5pts) The following data set called “LIBRARY” contains 7 observations and 3 variables.
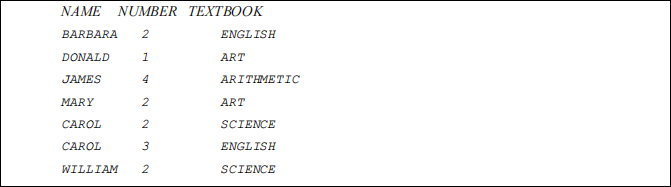
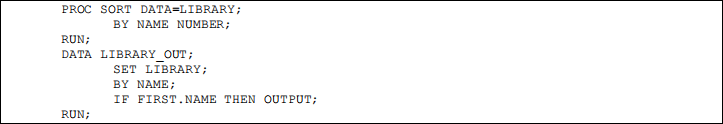
Briefly explain what each main component of the following code does. What is the third observation in “LIBRARY_OUT”?
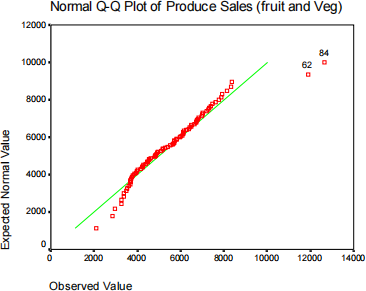
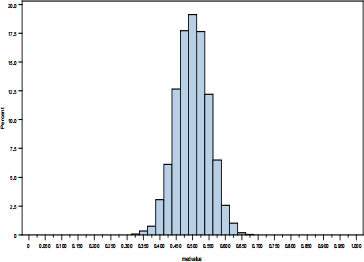
(b)(5pts) The following plot is constructed from a data set with 84 observations. Each observation represents one supermarket store and the outcome of interest is the daily amount of produce sales. Describe this graph and the findings.
Question 3
(a)(5pts) Consider the following linear system of equations:
3x1 + 5x2 = 20
x1 + x2 =10
Write down the system in matrix form, and write down the IML code that computes and the solution of this system.
(b)(5pts) Suppose the linear system of equations is:
3x1 + 5x2 = 20
1.0000000000000000001x1 + x2 =10
What solution will you expect from the IML code? Briefly explain why.
Question 4
(a)(5pts) The code below generates a histogram as follows:
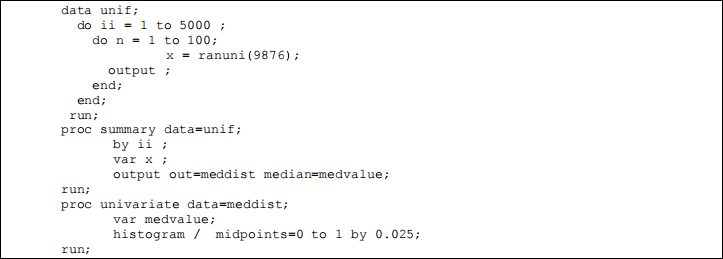
Briefly explain what each main component of the above code does.
(b)(5pts) Continuing part (a), suppose we run this code:

and then plot a histogram of x in “unif_data”, which looks like:
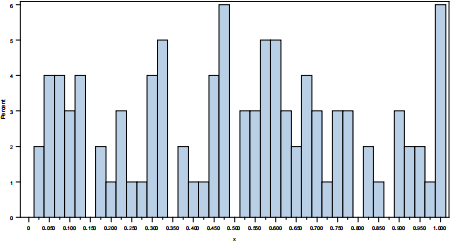
Briefly describe how you would use the bootstrap method to construct a confidence interval for the median of x in “unif_data”.
Question 5 (15 pts)
Consider the following input-output table for a two-sector economy:
|
|
Outputs |
|
||
|
Inputs |
Sector 1 |
Sector 2 |
Total output |
Final demand |
|
Sector 1 |
10 |
70 |
? |
75 |
|
Sector 2 |
100 |
5 |
200 |
? |
(a)(5pts) Compute the missing values in the table, and compute the matrix of technological coefficients.
(b)(5pts) Use the approximation formula (I − A) ≈ I + A + A ∗ A to compute the Leontief inverse of A.
(c)(5pts) Suppose the final demand for good 2 increases by 10 percent. What are the increases (in percent) in total output in sectors 1 and 2, respectively? Show your working.Question 3 (20 pts)
Question 6 (20pts)
6.I The following code generates a data set with pseudo-random numbers.
6.I.A (3pts) What random process defines the variable x? Describe the random number generator used by this code. What are the potential drawbacks of the random variables created by this code.
6.I.B (2pts) Describe what the unif dataset looks like that was created by this code. What are the variables in the dataset. How many observations are generated by this code?
|
data unif; do ii = 1 to 5000 ; do n = 1 to 100; x = exp(rannor(9897)); x = x * ( ( ( ranuni(9875) < .55 ) * 10 ) - 5) ; output ; end; end; run; |
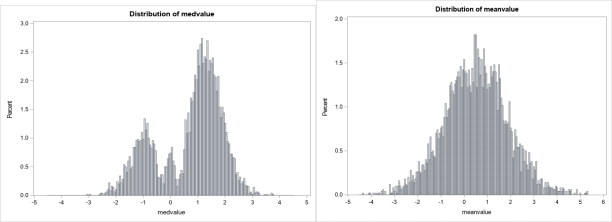
6.II. The code below uses the results of the code in part 3.I and generates a histogram as follows
6.II. A(5pts) Explain what each main component of the code below does and describe what these graphs show and why they are shaped as they are.
|
proc summary data=unif; by ii ; var x ; output out=meddist median=medvalue mean=meanvalue; run; proc univariate data=meddist; var medvalue meanvalue; histogram / midpoints=-4.5 to 4.5 by 0.05; run; |
6.II.(10pts) Continuing part II. A, suppose we run the code given below:
|
proc kde data=meddist; univar medvalue/ out=kde1 cdf ngrid=2000 ; univar meanvalue/ out=kde2 cdf ngrid=2000 ; run; title " " ; data total ; set kde1 kde2 ; run; proc sgplot data=total ; series y=distribution x=value / group= var ; refline .025 .05 .1 .5 .9 .95 .975 / axis=y ; yaxis values=( 0 to 1 by .05 ); xaxis values=( -3.4 to 4.4 by .2 ) grid ; run; |
This produces the plot shown below:
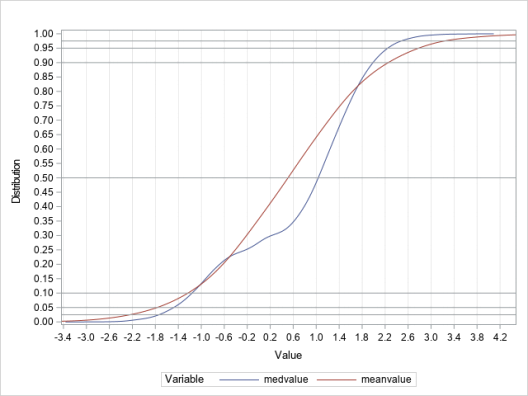
6.II.A(4pts) Describe what this code does.
6.II.B(3pts) What would be the 95% confidence interval for the median of x in the dataset unif. What sort of interval is this?
6.II.C(3pts) What would be the 95% confidence interval for the mean of x in the dataset unif. What sort of interval is this?
2023-06-16