ECF2721 SAMPLE EXAM Q&A 1
Hello, dear friend, you can consult us at any time if you have any questions, add WeChat: daixieit
ECF2721 SAMPLE EXAM Q&A 1
Use the following to answer questions 1 - 3.
Consider Country A who uses dollars as the currency of the country. The country had only the following international transactions in 2019.
An exporter of Country A sold 10 million dollars’ worth of goods to U.S.A. With the receipt of 10 million dollars, the exporter purchased the U.S. treasury bonds.
Q1
What is the current account balance (in million dollars) of Country A in 2019 (zero decimal places)?
Answer: 10
Export of the goods: CA = EX-IM + EXFS-IMFS + NUT = 10
Q2
What is the financial account balance (in million dollars) of Country A in 2019 (zero decimal places)?
Answer: -10
Imports of assets: 10, FA = EXA-IMA = -10
Q3
If the valuation effects were 5 million dollars for the external wealth of Country A in 2019, what is the change of the external wealth (in million dollars) of Country A in 2019 (zero decimal places)?
Answer: 15
Change of the external wealth = valuation effects - FA = 5- (-10) = 15
Use the following hypothetical national income and product accounts data (billions of dollars) in 2017 to answer questions 4 - 6.
. Consumption (personal consumption expenditures): 50
. Investment (gross private domestic investment): 10
. Government consumption (government expenditures): 20
. Net exports of goods and services: -10
. Net factor income from abroad: -15
. Net unilateral transfers: 10
. Capital account balance: 5
. Statistical discrepancy: 0
. The external wealth at the beginning of 2017: 500
. The external wealth at the end of 2017: 480
Q4
What is the Gross National Income (in billion dollars) of the country in 2017 (zero decimal places)?
Answer: 55
GNI = C+ I + G + TB + NFIA = 50 + 10 + 20 + (-10) + (-15) = 55
Q5
What is the current account balance (in billion dollars) of the country in 2017 (zero decimal places)?
Answer: -15
CA = TB + NFIA + NUT = -10 + (-15) + 10 = -15
Q6
What is the financial account balance (in billion dollars) of the country in 2017 (zero decimal places)?
Answer: 10
FA = - CA - KA = -(-15) - 5 = 10
Use the following information to answer questions 7 - 9.
Use the money market with the general monetary model, and foreign exchange (FX) market to answer the following questions.
Consider 2 countries, country A (using dollars) and B (using pounds). In Country A, the money supply, M(A), is 200 million dollars, the real income, Y(A), is 200 million, the the price level P(A), is 2 dollars, and the annual nominal interest rate, i(A), is 5 percent. In Country B, the money supply, M(B), is 100 million pounds, the real income, Y(B), is 200 million, the the price level, P(B), is 1 pound, and the annual nominal interest rate, i(B), is 5 percent. These two countries have maintained the long-run levels with the nominal exchange rate E(A/B) of 2.00. Assume that both countries have perfect capital mobility. Note that the uncovered interest parity (UIP) holds all the time and the purchasing power parity (PPP) holds only in the long-run. Assume that the new long-run levels are achieved within 1 year from any permanent changes in the economies.
Now, today at time T, the real income of Country A fell by 3% permanently. With the fall of the real income in Country A, the annual nominal interest rate in Country A fell by 2 percentage points, from 5% to 3% today. Unless otherwise noted, assume that the money supply in Country A, the real income in Country B, and the money supply in Country B, do not change at all. Treat Country A as the home country. In answering the questions use the exchange rate defined as the units of country A's currency per 1 unit of country B's currency, E(A/B). Assume that both countries use the floating exchange rate system in answering questions 7 and 8.
Q7
Using the exact equation of the uncovered interest parity, calculate the exchange rate, E(A/B), today after the permanent fall of the real income of Country A (two decimal places).
Answer: 2.10
With the fall of the real income by 3%, the price rises by 3% in the long run, which results in 3% rise the long-run exchange rate.
From the uncovered interest parity, we have
(1+i(A)) = Ee((A/B)/E(A/B)x(1+i(B)). With the new rates, we have
E(A/B) = Ee(A/B)x(1+i(B))/(1+i(A)) = 2x(1.03)x1.05/1.03 = 2x1.05 = 2.10
Q8
Explain (in words) how this change affects the money market in Country A and the FX market in the short-run, and in the long-run.
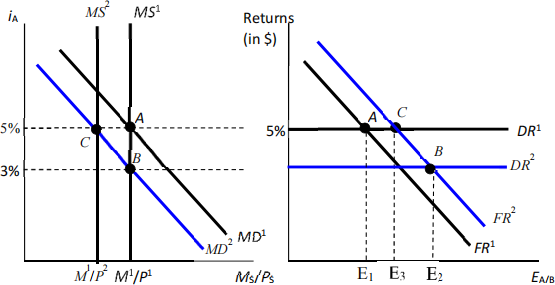
For the short-run equilibrium, be sure to state the movements (shifts) of all curves (MD and MS curves in Country A, DR and FR curves) starting from the initial long-run equilibrium including the reasons for the shifts, and the movements of equilibrium levels (relative to the initial levels) for Country A’s annual nominal interest rate, i(A), real money balance, M(A)/P(A), and the exchange rate today, E(A/B), to get full marks.
(ii) For the long-run equilibrium, be sure to state the movements (shifts) of all curves (MD and MS curves in Country A, DR and FR curves) starting from the short-run equilibrium including the reasons for the shifts, and the movements of equilibrium levels (relative to the initial levels) for Country A’s annual nominal interest rate, i(A), real money balance, M(A)/P(A), and the exchange rate, E(A/B), to get full marks.
Answer:
(i) Short run
With the fall of the real income, the money demand falls which shifts the MD curve to the left (downward).
This lowers the interest rate to 3% as stated in the question.
With the same money supply and the price level in the short run, the real money balance, M(A)/P(A), does not change in the short run with the same M(A) and P(A).
The fall of the interest rate to 3% lowers the DR curve downward in the FX market.
At the same time, the rise of the long-run exchange rate, which is equal to the expected exchange rate in 1 year, shifts the FR curve upward (to the right).
With these shifts of DR and FR curves, the current spot exchange rate today, E(A/B), rises.
(ii) Long-run:
After achieving the short-run equilibrium, the price level rises to get to its long run level. This lowers the money balance, M(A)/P(A), and shifts the MS curve to the left.
Thus, the interest rate rises and goes back to the original level, 5%.
With the rise of the interest rate back to the original level, DR curve shifts up and goes back to the original level.
The FR curve does not change any more as the expected exchange rate remains at the new long run level and the foreign interest rate does not change at all.
With the shifts of the DR curve, the exchange rate achieves the new long run level.
No graph drawing questions. But, here are graphs for the explanations.
Q9
Following the permanent fall of the real income, if the central bank of Country A wants to keep the exchange rate at 2.00 all the time, what should be the growth rate (zero decimal places) of the money supply in Country A today?
Answer: -3%
With the fall of the real income by 3%, the real money demand falls by 3%. To maintain the exchange rate at 2, the central bank has to keep the interest rate as before, at 5%. This means that the real money supply should go down by same percent as the real money demand does. This can be achieved by decreasing the money supply by 3%.
Use the following information to answer questions 10 and 11.
Suppose the home economy was initially at the long run equilibrium. The consumption in the country depends on the disposable income, Y-T, C = C(Y-T), and the investment depends on the interest rate of the country, i, I = I(i). Assume the home country follows a floating exchange rate system. Now, there is an increase of the expected future spot exchange rate (units of home currency per one unit of foreign currency).
Q10
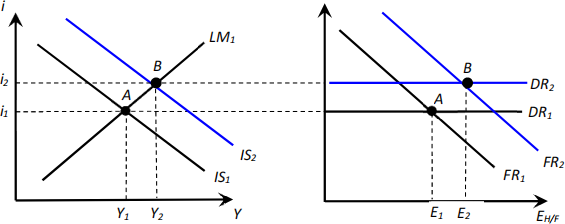
Use the IS-LM-FX model to explain (in words) the short run effects of the increase in the expected future spot exchange rate. Be sure to explain movements (shifts) of all curves starting from the initial long run equilibrium including the reasons for the shifts, and the movements of equilibrium levels (relative to the initial levels) for the home country's interest rate, income (output) level, and the exchange rate (amount of home currency per one unit of foreign currency) to get full marks.
Answer:
With the rise of the expected future spot exchange rate, the IS curve shifts to the right, and the FR curve shifts to the right.
With the shift of the IS curve, the interest rate and the income increase.
The DR curve shifts up with the higher home interest rate.
Although the higher home interest rate lowers the exchange rate, the spot exchange rate today becomes higher than the initial level because the rise of the FR curve due to the increase of the expected future spot exchange rate is dominating the fall of the exchange rate due to a rise of the home interest rate.
No graph drawing questions. But, here are graphs for the explanations.
Q11
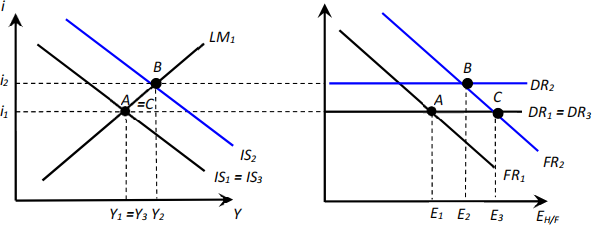
Following the increase of the expected future spot exchange rate, the government of the home country changes the government spending to maintain the output at the initial level. Use the IS-LM- FX model to explain (in words) the short run effects of this policy. Be sure to explain movements (shifts) of all curves starting from the short run equilibrium after the increase of the expected future spot exchange rate but before the policy implementation including the reasons for the shifts, and the movements of equilibrium levels relative to the initial long-run equilibrium levels for the interest rate, income (output) level, and the exchange rate (amount of home currency per one unit of foreign currency) to get full marks.
Answer:
To maintain the output at the initial level, the government has to reduce the government spending.
This shifts the IS curve to the left.
This lowers the interest rate and the income back to the original levels.
As the home interest rate goes back to the original level with the cut of the government spending, DR curve shifts back to the original level.
This lowers the exchange rate relative to the rate without the policy implementation.
As FR curve stays as the new curve with the higher expected future spot exchange rate, the downward shift of the DR curve further raises the exchange rate.
No graph drawing questions. But, here are graphs for the explanations.
Q12
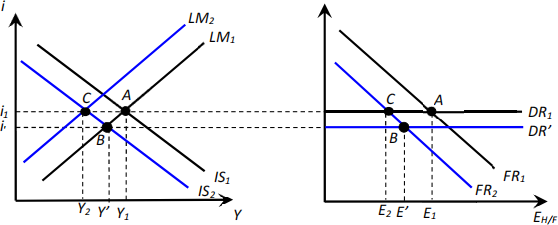
Suppose the home economy was initially at the long run equilibrium. The consumption in the country depends on the disposable income, Y-T, C = C(Y-T), and the investment depends on the interest rate of the country, i, I = I(i). Assume the home country follows a fixed exchange rate system. Now, the central bank of the home country revaluates its currency, decreases of the current and expected par values of exchange rate, E(H/F), and Ee(H/F). Use the IS-LM-FX model to explain (in words) the short run effects of the revaluation. Be sure to explain movements (shifts) of all curves starting from the initial long run equilibrium including the reasons for the shifts, and the movements of equilibrium levels (relative to the initial levels) for the home country's interest rate, income (output) level, and the exchange rate (amount of home currency per one unit of foreign currency) to get full marks.
Answer:
With the revaluation,
The IS curve shifts to the left which lowers the interest rate and the home income. The fall in the home interest rate shifts the DR curve downward.
At the same time this revaluation shifts the FR curve to the left as the expected exchange rate falls.
These shifts of DR and FR curve lowers the exchange rate. However, the exchange rate without further actions from the central bank is higher than the new par value of the exchange rate.
Thus, the central bank has to reduce the money supply to achieve the new par value of the exchange rate.
This shifts the LM curve to the left so that the interest rate goes back to the original level. This shift of the LM curve further lowers the income in the home country.
As the home interest rate goes back to the original level with the change of the money supply, the DR curve goes back to the initial level, and the new par value of the exchange rate is achieved.
No graph drawing questions. But, here are graphs for the explanations.
ECF2721 SAMPLE EXAM Q&A 2
1. Use the money market with the general monetary model, and foreign exchange (FX) market to answer the following questions. The questions consider the relationship between the U.K. British pound (£) and the Australian dollar ($). In the U.K., the real income (Y£) is 5.0 trillion, the money supply (M£) is £10.0 trillion, the price level (P£) is £4.0, and the nominal interest rate (i£) is 5.0% per annum. In Australia, the real income (Y$) is 2.0 trillion, the money supply (M$) is $8.0 trillion, the price level (P$) is $8.0, and the nominal interest rate (i$) is 5.0% per annum. These two countries have maintained these long-run levels. Thus, the nominal exchange rate (E$/£) has been 2.00. Note that the uncovered interest parity (UIP) holds all the time and the purchasing power parity (PPP) holds only in the long-run. Assume that the new long- run levels are achieved within 1 year from any permanent changes in the economies.
Now, today at time T, the money supply of Australia (M$) rose to $8.24 trillion, by 3.0%, permanently. With the increase of the money supply in Australia, the Australian interest rate falls to 3.0% per annum today. Assume that Y$, Y£ , and M£ do not change at all.
(a) Calculate the depreciation rate of the Australian dollar against the U.K. pound today (NOT over one
year from today), %ΔE$/£ . Approximation is allowed.
ANSWER:
UK: Y£=5, M£=10, P£=4, i£ = 5%. 个 L£ (5%) = M£/(P£ ×Y£) = 0.5
AU: Y$=2, M$=8, P$=8, i$ = 5%.个 L$(5%) = M$/(P$ ×Y$) = 0.5
So in the long run we have
E$/£ = P$/P£ = 8/4 = 2.
Now, M$ rose to 8.24 (by 3%).
Answer with exact equations:
In the new long run, AU will have Pe$= M$,new /(L$Y$) = 8.24/(0.5x2) =8.24 (3% increase).
This gives the new long-run exchange rate of
Ee$/£ = Pe$/Pe£ = 8.24/4 =2.06.
Using the UIP, we have the new current spot exchange rate of
E$/£,new = Ee$/£ ×(1+i£)/(1+i$) = (2×1.03)×1.05/1.03 = 2.10.
The depreciation rate today is
E$/£,new/E$/£,old - 1 = 2. 10/2.0 – 1 = 0.05 = 5%.
Answer using approximation
M$ rises by 3% 个 P$ rises by 3% (to 8.24) in the long run 个 E$/£ rises by 3% in the long run (Ee$/£ = 2.06).
From UIP, we have E$/£,new = Ee$/£/(1+ i$ – i£) = (2×1.03)/0.98 = 2.102.
This gives the depreciation rate today as E£/$,new/E£/$,old - 1 = 2. 102/2.0 – 1 = 0.051 = 5. 1%.
(b) Using the money market for Australia and the FX market diagrams below (replicate them in your
answer book), explain (in words) how this change affects the money market for Australia and the FX market.
For the short-run equilibrium, be sure to state the movements (shifts) of all curves (MD and MS curves in Country A, DR and FR curves) starting from the initial long-run equilibrium including the reasons for the shifts, and the movements of equilibrium levels (relative to the initial levels) for Australia’s annual nominal interest rate, i($), real money balance, M($)/P($), and the exchange rate today, E($/£), to get full marks.
For the long-run equilibrium, be sure to state the movements (shifts) of all curves (MD and MS curves in Australia, DR and FR curves) starting from the short-run equilibrium including the reasons for the shifts, and the movements of equilibrium levels (relative to the initial levels) for Australia’s annual nominal interest rate, i($), real money balance, M($)/P($), and the exchange rate, E($/£), to get full marks.
ANSWER:
With the rise of AU money supply by 3%, the MS curve shifts to the right. With the same income and the price level today, the interest rate in AU falls to 3%, which shifts the DR curve downward. With the rise of the AU money supply by 3% and the same price level in the short run, the real money balance in Australia rises by 3%.
With the increase of the AU money supply by 3%, it is expected that the price in AU will rise by 3% in the long run. Thus, the expected exchange rate, Ee$/£ , the long-run exchange rate, rises by 3%. This shifts the FR curve to the right. With these changes, the exchange rate today, E$/£ , becomes 2.10.
In the long-run the price level rise to 8.24 (by 3%). This shifts the MS curve to the left back to the original curve, M($)/P($) back to the original level, and raises the interest rate back to 5%. With the interest rate of 5% the DR curve goes back to the original curve. The exchange rate becomes 2.06 with these changes in the long-run.
2. Suppose the economy was initially at the long run equilibrium. The consumption in the country depends on the disposable income, Y– T, C = C(Y– T) and the investment depends on the interest rate of the country, i, I = I(i). The applicable IS-LM-FX model is pictured here:
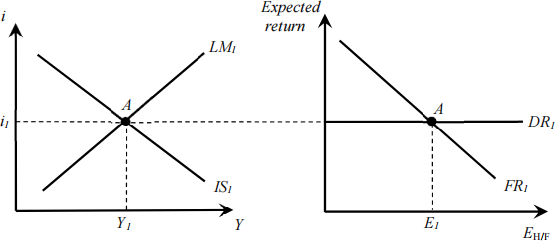
Assume the home country follows a floating exchange rate system. Now, there is a fall in the foreign interest rate, i*.
(a) Use the IS-LM-FX model to explain the short-run effects of the fall in the foreign interest rate. Be
sure to explain movements (shifts) of all curves starting from the initial equilibrium including the reasons for the shifts, and the movements of equilibrium levels (relative to the initial levels) for the home country's interest rate, income (output) level, and the exchange rate (amount of home currency per one unit of foreign currency) to get full marks.
ANSWER:
With the fall of the foreign interest rate, the IS curve shifts to the left and the FR curve shits to the left. With these changes, the income falls and the interest rate falls in the country. With a lower interest rate, the DR curve shifts downward, and the exchange rate today falls (an appreciation of home currency).
(b) In the situation of (a), use the goods market equilibrium equation and the three elements that
determine the trade balance to explain the impact ofthe policy on
(i) today’s exchange rate, and
(ii) the trade balance of the home country
![]() (increase/no-change/fall) compared to the initial level.
(increase/no-change/fall) compared to the initial level.
ANSWER:
From the national income identity (goods market equilibrium), we have TB = (Y-C) – G – I. We know that Y fell due to the fall of the foreign interest rate. Thus Y-C falls. With a lower interest rate, the investment rises. The government spending, G, does not change in this scenario. This means that the TB falls following the changes.
Three variables affect the TB; home disposable income, foreign disposable income and the exchange rate. Here, the foreign income does not change at all. The home income falls which raises the trade balance. We also know that the trade balance should fall from the national income identity. Thus, the change in the exchange rate should reduce the trade balance. This means that the exchange rate should fall following the fall of foreign interest rate.
(c) Following the drop of the foreign interest rate, the central bank of the home country changes the money supply to maintain the same level of output as before (Y1). Use the IS-LM-FX model to explain the short-run effects of this policy. Be sure to explain movements (shifts) of all curves starting from the equilibrium in (a) including the reasons for the shifts, and the movements of equilibrium levels (relative to the initial levels) for the home country's interest rate, income (output) level, and the exchange rate (amount of home currency per one unit of foreign currency) to get full marks.
ANSWER:
Now with the situation in (a), the central bank has to raise the money supply to maintain the output level at Y1 . This shifts the LM curve to the right. Thus, the interest rate falls further which shifts the DR curve further downward. With these changes, the exchange rate becomes higher than (a) but still lower than the initial level of E1 .
3. Suppose the economy was initially at the long-run equilibrium. The applicable IS-LM-FX model is pictured here:
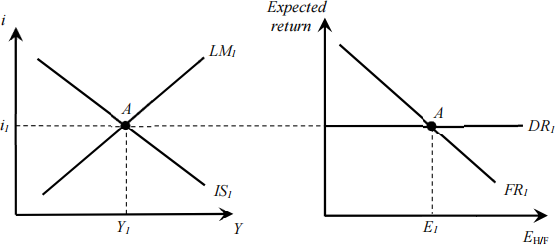
Assume the home country follows a fixed exchange rate system. Now, home country devaluates its currency, increases in the current and expected par values of exchange rate, EH/F, and EeH/F.
(a) Assume that the consumption in the country depends on the disposable income, Y– T, C = C(Y– T)
and the investment depends on the interest rate, i, I = I(i). Use the IS-LM-FX model to explain the short-run effects of the devaluation. Be sure to explain movements (shifts) of all curves starting from the initial equilibrium including the reasons for the shifts, and the movements of equilibrium levels (relative to the initial levels) for the home country's interest rate, income (output) level, and the exchange rate (amount of home currency per one unit of foreign currency) to get full marks.
ANSWER:
With the devaluation, the expected exchange rate rises to the new par value. This shifts the FR curve to the right, and the IS to the right. Without further action from the central bank, the interest rate would be lowered and the exchange rate would be less than the new par value. Thus, the central bank has to raise the money supply to maintain the new par value of the exchange rate. This shifts the LM curve to the right. With these changes, the interest rate stays at the initial level at i(1), the income level rises, and the new par value can be maintained.
(b) Now assume that the consumption in the country depends on the disposable income and the total
wealth, Y– T and Wealth, C = C(Y– T, Wealth) and the investment depends on the interest rate and the total wealth of the country, i and Wealth, I = I(i, Wealth). Assume further that the devaluation of the country’s currency increases its total wealth significantly due to the valuation effect on the external wealth. Use the IS-LM-FX model to explain the short-run effects of the devaluation together with the valuation effects on the total wealth. Be sure to explain movements (shifts) of all curves starting from the initial equilibrium including the reasons for the shifts, the movements of equilibrium levels (relative to the case in (a)) for the home country's interest rate, income (output) level, and the exchange rate (amount of home currency per one unit of foreign currency) to get full marks.
ANSWER:
With the devaluation, the expected exchange rate rises to the new par value. This shifts the FR curve to the right, and the IS to the right. With the valuation effect, home external wealth increases following the devaluation. This raises the total wealth of the country. With the rise of the total wealth, consumption and investment rises. This shifts the IS curve further to the right compared to the case in (a). To maintain the new par value of the exchange rate, the central bank has to raise the money supply. This shifts the LM curve further to the right compared to the case in (a). With these changes, the interest rate is maintained at the original level, home income rises more than the case in (a), and the exchange rate is maintained at the new par value.
2023-06-15