STAT0015: MEDICAL STATISTICS 2
Hello, dear friend, you can consult us at any time if you have any questions, add WeChat: daixieit
Examination Paper For STAT0015 (Level 6 and 7)
STAT0015: MEDICAL STATISTICS 2
2020
● Answer ALL questions.
● You may submit only one answer to each question.
● The relative weights attached to each question are as follows: Q1 (6), Q2 (5), Q3 (3), Q4 (8), Q5 (5), Q6 (11), Q7 (7), Q8 (8), Q9 (7).
● The numbers in square brackets indicate the relative weights attached to each part question.
● Marks are awarded not only for the final result but also for the clarity of your answer.
Administrative details
● This is an open-book exam. You may use your course materials to answer questions. Some questions may ask you to solve, or not to solve, a problem in a particular way; please take note of this. Failure to do so may result in marks being deducted.
● You may not contact the course lecturer with any questions, even if you want to clarify something or report an error on the paper. If you have any doubts about a question, make a note in your answer explaining the assumptions that you are making in answering it.
● UCL requires that all 24-hour online exams have a specified overall word limit. The overall word limit for this exam has been set well in excess of the expected amount of work so that you do not need to worry about exceeding it. Therefore, we expect that solutions to the paper will be much shorter than the specified word limit.
● Some part-questions may indicate a word or sentence limit. You must adhere to this or risk losing marks.
Formatting your solutions for submission
● Some part-questions require you to type your answers instead of handwriting them. These questions state [Type] at the start of the part-question. You must follow this instruction. Failure to do so may result in marks being deducted. For questions without the [Type] instruction, you may choose to type or hand-write your answer.
● You should submit ONE document that contains your solutions for all questions/part-questions. Please follow UCL's guidance on combining text and photographed/scanned work.
● Make sure that your handwritten solutions are clear and are readable in the document you submit. You are encouraged to write out solutions neatly once you are happy with them.
Plagiarism and collusion
● You must work alone. In particular, any discussion of the paper with anyone else is not acceptable. You are encouraged to read the Department of Statistical Science's advice on collusion and plagiarism, which you can find here.
● Parts of your submission will be screened via Turnitin to check for plagiarism and collusion.
● If there is any doubt as to whether the solutions you submit are entirely your own work you may be required to participate in an investigatory viva to establish authorship.
Question 1 [6 marks]
Researchers are designing a cross-over trial to investigate the use of pioglitazone hydrochloride to control severe asthma.
a) [Type] Asthma is a chronic, stable disease. Why are these characteristics important when using a cross-over trial design? [1]
b) Calculate the sample size required for this cross-over trial assuming that the corresponding parallel design requires 170 patients and that there is a correlation of 0.7 between measurements on the same patient. [2]
c) [Type] Briefly describe how to produce a suitable randomisation list for this trial and show how the list might look for the first 10 patients. [3]
Note: It is not necessary to describe how random numbers could be generated using, for example, a coin, dice or computer.
Question 2 [5 marks]
A trial was carried out to investigate the effect of a new drug for hypertension. Age, gender, BMI, systolic blood pressure and comorbidity were measured at baseline. The primary outcome was systolic blood pressure at 6 months but several patients dropped out of the trial before this could be measured. However, systolic blood pressure was measured for all patients at 3 months as a secondary outcome.
a) [Type] Briefly describe how the researchers could use multiple imputation as part of their trial analysis. [3]
b) [Type] How might you investigate the potential impact of missing data using descriptive statistics? [2]
Question 3 [3 marks]
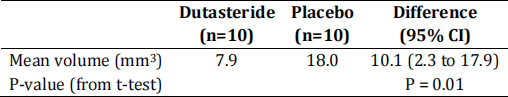
A study is planned to investigate whether dutasteride is capable of shrinking tumours in men with prostate cancer. Forty patients are to be randomised to either dutasteride or placebo and the primary outcome is tumour volume at 6 months. This is to be analysed using a two-sample t-test. The trial is designed to have a type I error of 5% and 90% power.
A single interim analysis is planned when outcome data has been collected on 20 patients. The researchers require a statistical stopping rule for efficacy.
a) [Type] Suggest an appropriate stopping rule and justify your choice. [2]
Note: You may find the following significance levels useful. Each is based on a single interim analysis and an overall Type I error of 5%.
 = 0.005 (O’Brien-Fleming), = 0.029 (Pocock), = 0.025 (Bonferroni)
b) [Type] The following results were obtained in the interim analysis. Based on your choice in part a), what would be your recommendation regarding the continuation of this trial? [1]
Question 4 [8 marks]
Researchers are planning a single arm Phase II study to investigate a new method of performing reconstructive throat surgery. The outcome of interest is improved voice function (yes/no). The trial will be deemed a success if the researchers can demonstrate that at least 70% of patients have improved voice function. The researchers believe that their technique will actually improve voice function for 95% of patients.
a) Calculate the sample size required for this study, given that 5% significance and 80% power are required. [3]
The researchers also consider using Simon’s two-stage optimal design. Stage 1 would involve 4 patients, with 4 improvements required for progression to stage 2, which would involve a further 17 patients. 18 improvements would be required in total for the trial to be deemed a success.
b) Confirm that this study design has a similar type I error and power to the previous design. [3]
c) What is the expected number of patients required for this study design if the new surgery is no better than the existing surgery? [2]
Question 5 [5 marks]
A systematic review was performed to identify all randomised, blinded, placebo-controlled clinical trials that evaluated acute  -blocker exposure in asthma. Of interest is whether respiratory function, measured using FEV1, is worse for asthmatic patients on -blockers. The results from five trials are shown in the table below. Higher values of FEV1 indicate better respiratory function.
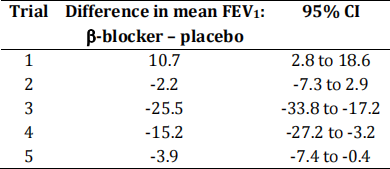
a) Perform a fixed effects meta-analysis and calculate a pooled estimate of the mean difference with a 95% confidence interval. Interpret these results. [5]
Note: The multiplier 1.96 may be used for all confidence intervals.
Question 6 [11 marks]
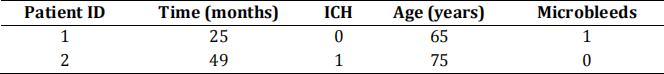
Researchers were interested in developing a model to predict the risk of intracranial haemorrhage (ICH) in patients treated with antithrombotic therapy after a stroke. The following Weibull proportional hazards model was used to investigate the relationship between ‘time to ICH’ and the predictors ‘age’ and ‘cerebral microbleeds’ (0=absent, 1=present).

a) Derive expressions for the contribution to the likelihood function for the following two patients. [3]
The following estimates were then obtained for this model.
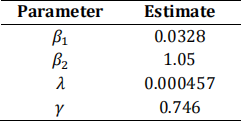
b) Use this information to predict the risk of ICH within 5 years for a patient aged 80 with cerebral microbleeds. [3]
c) [Type] Briefly describe how we might investigate graphically whether the proportional hazards assumption holds for this model. [3]
The following table shows the observed survival data and predicted risk of ICH (within 5 years) for five patients.
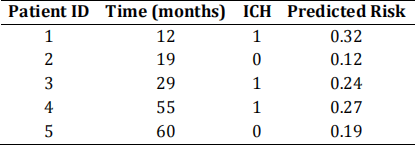
d) Calculate the c-index based on these five patients. [2]
Question 7 [7 marks]
A randomised trial is planned to investigate the effectiveness of an active drug versus placebo to treat patients suffering from chronic regional pain syndrome. The endpoint of interest is pain score which takes values between 0 and 10, with higher values indicating more pain, and this is to be recorded daily for 4 weeks by each patient. Not all patients record a pain score on each of the 28 days.
a) [Type] Why might the researchers want repeated measurements of the outcome? [2]
b) [Type] Briefly describe how the data from this trial could be analysed using a summary statistics approach. [3]
c) Alternatively, the data could be analysed using a marginal model estimated using generalised estimating equations. Using notation, briefly describe an appropriate correlation structure that could be used within this model and justify your choice. [2]
Question 8 [8 marks]
A group of researchers developed the following prognostic model to predict the risk of 30-day mortality for patients undergoing heart valve surgery, where Age is measured in years, Type is type of surgery (0=aortic, 1=mitral) and Priority is surgical priority (0=elective, 1=urgent or emergency).

a) What is the risk of 30-day mortality for a 70-year old patient who is to have emergency surgery on a mitral valve? [2]
The model is subsequently externally validated by other researchers and the following results are produced.
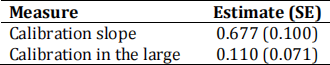
b) [Type] Comment on these results. [2]
These researchers also investigate a cut-off that could be used to make a clinical decision regarding whether a patient will die within 30 days of surgery. The performance of this decision rule is summarised below.

c) Use the values in the table to construct a simple ROC curve and estimate the c- statistic. [3]
d) [Type] Why is the positive predicted value (PPV) much lower than the other values? [1]
Question 9 [7 marks]
A clinical trial was performed to investigate the effect of low-dose colchicine following myocardial infarction. Patients from several hospitals were randomised to receive either colchicine or placebo and the primary outcome was time to coronary event.
a) [Type] Why should we take account of clustering when analysing the data from this trial? [2]
b) Specify an appropriate model that could be used to analyse these data. [3]
A model was fitted and the estimated coefficient for treatment was  = −0.261 (95% CI: − 0.494 to − 0.041).
c) [Type] Interpret these results. [2]
2021-08-11