ECON7040 Macroeconomic Analysis Semester 1, 2023 Quiz I
Hello, dear friend, you can consult us at any time if you have any questions, add WeChat: daixieit
ECON7040 Macroeconomic Analysis
Semester 1, 2023
Quiz I
Your answer should be typed. For questions with many equations, if you can’t type, you can handwrite. Diagrams can be drawn by hand or by digital tool and inserted in your answer.
You are not allowed to copy and paste diagrams from textbook or lecture, tutorial
materials. Submit your answer as ONE file (pdf or word but pdf is recommended). Part A: Multiple Choice Question (15 marks)
1. Assume we are in the basic Solow model. Two economies are in the transition to their long-run equilibrium. Economy 1’s GDP per-capita is growing at 4% while Economy 2’s GDP per-capita is growing at 3%. Both economies have: s = 0.2, a = 1/3, 6 = 0.1, and a current level of capital per-capita of kt = 1. Using the lecture notes’ formula for the growth rate of y, what is the level of technology of Economy 1 (A1 ) and Economy 2 (A2 )?
A. A1 = 1.1 and A2 = 1.
B. A1 = 1.1 and A2 = 0.95.
C. A1 = 0.95 and A2 = 0.8.
D. A1 = 0.8 and A2 = 0.9
2. What are predictions about the evolution of per-capita variables (k, y, c, i) and input prices (w, T) in the basic Solow model when the economy is hit by a positive shock to technology A (assume Cobb- Douglas production function and the economy is initially at the steady state)?
A. At the time of the shock, k, y, c, i, w, and T increase and then smoothly converge to the new higher steady state level.
B. At the time of the shock, k, y, i, and w increase, while c and T decrease. They then converge to the new steady state with higher k∗, y ∗, i∗, w ∗, and lower c ∗ and T ∗ .
C. At the time of the shock i and c increase. In the next period, i, c, k, y, T, and w start to increase. Then, all variables converge to the new steady state with higher i∗, c ∗, k∗, y ∗, w∗and T ∗ .
D. At the time of the shock i, c, y, w, and T increase. In the next period, k, i, c, y, and w increase smoothly until they converge to a new higher equilibrium. In the next period, T starts to decrease and it converges to initial long-run level.
3. Which of the following is false about the growth facts discussed in Lecture 1?
A. Few percentage points difference in average growth can make an important difference in long-run GDP per-capita levels.
B. The post-war growth rate of GDP per-capita in developed economies is steady and close to 2%.
C. Even though there are differences in the evolution of GDP per-capita, all countries appear to converge to the same level of GDP per-capita.
D. Growth miracles and growth disasters exist.
4. Which of the following production functions displays decreasing returns to scale?
A. Y = AK0.7 N 0.3
B. Yt = lnKt + lnNt
C. Y = AK0. 5 N 0.4
D. Both B & C
5. In the two-sector endogenous growth model, if F + e > 1, the fraction of labor in R&D sector affects:
A. level of income.
B. growth rate of income.
C. level of income and growth rate of income.
D. level of income, growth rate of income, and growth rate of the stock of knowledge
Part B: Short-answer question (25 marks)
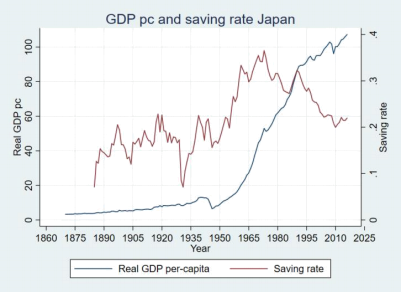
1. (8 marks) Figure 1 shows the evolution of GDP per-capita and the saving rate of Japan. Use the Augmented Solow model and the historical events affecting Japan to
describe the evolution of these variables, in isolation and together.
Figure 1:
2. (8 marks) Evaluate the following statement as true/false/uncertain and explain your answer carefully. Please use diagrams and/or algebra when answering the question, when appropriate.
According to the Solow model, steady state consumption per capita will be higher in countries that (i) have a better technology, (ii) less population growth, and (iii) have a higher saving rate .
3. (9 marks)
Suppose that we have a Solow model with one twist . The twist is that there is a government. Hence, the aggregate resource constraint is: Yt = Ct + It + Gt
where Gt = Tt (public expenditure is financed by taxation) and Tt = TYt .
Define private output as Ytp = Yt − Gt . Suppose that private investment is a constant fraction, s, of private output (consumption is then 1 − s times private output). A fraction of sG Gt is spent on public investment, which supplements the productive
capital stock. Otherwise the model is the same as in the lecture.
Derive the transition dynamic equation for this economy.
Part C: Problem-Solving question (60 marks)
Question 1: (15 marks)
As an economic advisor to the Treasurer of country A, you are required to provide some assessment of the likely impact of an increase in the tax rate from its current level of 38% percent to a new proposed level of 45 percent.
The first element of your analysis is the calibration of a theoretical model with the following elements:
Production Function: Y = AKa N1−aG 1−a
Budget constraint: G = TY
Physical capital accumulation: ∆K = s(1 − T)Y − 6K
Y is the level of total GDP, K is the stock of physical capital, N is the stock of labour, G is government expenditure, A denotes the level of technological efficiency – which is assumed to be constant.
Your team of economic analysists provides the following information:
• The rate of population growth in this country is zero and expected to remain at zero for the long-term
• The saving rate (s) is 30%
• The Labor stock is 300 units
• The rate of capital depreciation (6) is 5%
• The current level of technological efficiency is measured as 0.15
• The production function is characterised by a = 0.4
Using this information, you prepare your analysis of the relationship between tax rate and growth rate of GDP per-capita:
a) (6 marks) Present and briefly comment a diagram representing the relationship between tax rate (displayed on the horizontal axis) and growth rate (displayed on the vertical axis), using the theoretical model and the information provided by your team of economic analysts.
b) (3 marks) Based on the results from part a, predict the rate of growth of the economy if the tax rate is increased to 45%. Briefly explain the economics underlying your result.
c) (3 marks) Based on your analysis, and assuming that the goal of the Treasurer is to maximise growth, what is your advice: should the tax rate be increased or not?
A member of your staff finds a very recent paper that present empirical estimates of the relationship between tax rate and growth rate based on a sample of countries similar to country A. The main result of the empirical estimates is reported in the following table
|
Variable in the regression equation
|
Estimated coefficient
*** means that the p-value of the estimated coefficient is smaller than 0.01 |
|
Constant
|
8.032***
|
|
Tax rate
|
1.012***
|
|
Tax rate squared
|
- 14.521***
|
d) (3 marks) Do the empirical findings of this paper make you change your advice as to whether the tax rate should be increased or not? Briefly explain why.
Question 2: (20 marks)
We are in the basic endogenous growth model studied in class. Suppose that the quantity of output is produced according to
Y(t) = [A(t)(1 − aL )L(t)] . New ideas are produced in this economy according to: Ȧ(t) = B[aL L(t)]yA(t)e , B > 0, y ≥ 1. Labor evolves according to L̇(t) = nL(t).
a) (4 mark) Find an expression for the growth rate of the growth rate of knowledge [ġA (t)/gA (t)]. Show your working (Hint: write the equation for gA (t) first) .
b) (6 marks) Assuming that e = 1, find the long-run growth rate of knowledge (gA(∗) ) and clearly explain its determinants.
b) (10 marks) Explain the evolution of the economy when e = 1 and there is a permanent increase in B. In particular, what are the predictions about short-run and long-run growth? Consider the cases when n = 0 and n > 0.
Question 3: (25 marks)
Suppose that the economy is well described by the augmented Solow model. Assume F (Kt,Zt Nt ) = AKt a Zt Nt 1−a . Also, assume that Zt and Nt grow at a rate equal to z and n, respectively. The transitional dynamics equation, in terms of efficiency units (![]() t =
t = ![]() ), is:
), is: ![]() t+1 =
t+1 = ![]() [sA
[sA ![]() t(a) + (1 − 6)
t(a) + (1 − 6)![]() t ]
t ]
a) (4 marks) Derive a formula for the steady state value of capital per-efficiency units and an expression for the long-run capital per capita.
b) (8 marks) Suppose that the economy reached its steady state. Unfortunately, an earthquake destructs a large fraction of the physical capital (K) in the economy. There is also a small reduction in population (N) due to the earthquake, but the reduction in K generates a significant decline in capital per capita (k). Describe and explain the evolution of k, y, C, i, T, and w (You need to draw the transition dynamic diagrams as well).
Now suppose that the level of productivity is fixed at A = 1. Suppose that s = 0.2 and 6 = 0. 1; a = 1/3. Let z = 0.02 and n = 0.01.
c) (3 marks) Solve for a numeric value of the steady state capital stock per efficiency unit of labor.
d) (6 marks) Use Excel to do this question. Suppose that the capital stock per worker initially sits in period 1 in steady state. Create a column of periods, ranging from period 1 to period 100. Use the central equation of the model to get the value of ![]() in period 2, given that is equal to its steady state in period 1. Continue to iterate on this, finding values of in successive periods up through period 9. In period 10, suppose that there is an increase in the population growth rate, from n = 0.01 to n = 0.02. Note that the capital stock per efficiency unit of labor in period 10 depends on variables from period 9 (i.e. the old, smaller value of n), though it will depend on the new value of n in period 11 and on. Use this new value of n, the existing value of the capital stock per efficiency unit of labor you found for period 9, and the central equation of the model to compute values of the capital stock per efficiency unit of labor in periods 10 through 100. Produce a plot showing the dynamic path of the capital stock per efficiency unit of labor from period 1 to period 100. (You don’t need to submit your excel file, just make sure your plot has the correct numeric values).
in period 2, given that is equal to its steady state in period 1. Continue to iterate on this, finding values of in successive periods up through period 9. In period 10, suppose that there is an increase in the population growth rate, from n = 0.01 to n = 0.02. Note that the capital stock per efficiency unit of labor in period 10 depends on variables from period 9 (i.e. the old, smaller value of n), though it will depend on the new value of n in period 11 and on. Use this new value of n, the existing value of the capital stock per efficiency unit of labor you found for period 9, and the central equation of the model to compute values of the capital stock per efficiency unit of labor in periods 10 through 100. Produce a plot showing the dynamic path of the capital stock per efficiency unit of labor from period 1 to period 100. (You don’t need to submit your excel file, just make sure your plot has the correct numeric values).
e) (4 marks) How does the increase in the population growth rate affect the dynamic path of the capital stock per worker and output per worker? Draw the dynamic response of capital per worker and output per worker in response to this population growth shock. (You don’t need to consider numeric values when drawing diagrams for this part).
2023-05-31