COMP90049 Introduction to Machine Learning Final Exam Semester 2, 2022
Hello, dear friend, you can consult us at any time if you have any questions, add WeChat: daixieit
COMP90049 Introduction to Machine Learning
Final Exam
Semester 2, 2022
Total marks: 120
Students must attempt all questions
Section A: Short answer Questions [28 marks]
Answer each of the questions in this section as briefly as possible. Expect to answer each question in 1-3 lines, with longer responses expected for the questions with higher marks.
Question 1: [28 marks]
(a) For each of the following statements, (1) Indicate whether it is true or false (2) Explain your answer
in 1-2 sentences. [5 marks]
(1) “K-Nearest Neighbor can be parameterized in a way such that perfect training performance is guaranteed.”
(2) “You are designing a model to detect driver fatigue using speed cameras on highways. Your ultimate goal is to prevent accidents that occur due to driver fatigue. For this task, precision is the most appropriate measure to use.”
(3) “You are given a dataset generated based on a linear model of polynomials of x, y = β0 + β 1x + β2x2 + β3x3 and you intend to fit a linear regression model yˆ = w0 + w1x by learning parameters w0 and w1 . Your model would result in high bias and high variance on the test set. ”
(b) Assume that you have a binary classification task, i.e., with labels yi ∈ {−1, 1}. You know the
underlying distributions that generate samples for each of the class labels. These distributions can be written as:
P(X|Y = 1) ≈ N(0, 2) (2)
where N(µ,σ) denotes the Gaussian distribution with mean µ and standard deviation σ . Answer the following questions with respect to this dataset. [4 marks]
(1) You have access to an unlimited amount of data and decide to use logistic regression. Can your logistic regression model achieve perfect training accuracy? Explain why. (2-3 sentences)
(2) Assume that you train your logistic regression model on a finite amount of data and achieve a training accuracy of 60%, what problem does the model suffer from and would standardizing the dataset improve training accuracy? Explain why. (2-3 sentences)
(c) Briefly answer the following: [3 marks]
(1) Compare Embedded and filtering approaches in terms of how they define the best feature(s). (2-3 sentences)
(2) Provide an example scenario where you would prefer using the filtering strategy in comparison to Embedded approaches. (1-2 sentences)
(d) You are given a dataset with three Boolean features, X = (X1,X2 ,X3 ), and a Boolean label, Y . You have trained (a) Naive Bayes and (b) Perceptron to learn the mapping from X to Y . For each classifier, (1) state whether using the learned model parameters, they can compute the P(X1,X2 ,X3 ,Y) or not and (2) justify your answer. [3 marks] (N.B. if your answer is yes, write down the formula for calculating P(X1,X2 ,X3 ,Y), otherwise state why you can’t compute this probability)
(e) Suppose you have trained a multilayer perceptron for classification on a dataset. Both the training
accuracy and the validation accuracy of the model are very low. (1) What problem does the model suffer from? (2) List one possible reason for this problem. (3) List two possible ways in which you would address this problem assuming you can only modify the model. [4 marks]
(f) Suppose you have trained a decision tree for classification on a dataset. The training accuracy of the
model is very high but the validation accuracy is very low. (1) Which ensemble model can be used to address the problem? (2) Briefly explain two ways this ensemble model address the problem. [3 marks]
(g) Suppose you have used AdaBoost for binary classification on a dataset. The first weak model assigns
wrong classes to 3/4 of the training data. (1) Will the next weak model update weights for all the misclassified data points? (2) If yes, will the model increase or decrease weights? If no, explain why. [3 marks]
(h) Suppose you want to detect anomalies in a dataset. You compute the pairwise distance between
every two data points to identify the number of neighboring points within a distance D for every data point. You identify a point as an anomaly if the number of its neighbours is smaller than a certain threshold p. You found that not all anomalies are identified. The dataset does not have various densities. You want to modify D and p to identify all anomalies. (1) Will you increase or decrease D? (2) Will you increase or decrease p? (note: No justification is required) [3 marks]
Section B: Method Questions [70 marks]
In this section you are asked to demonstrate your conceptual understanding of the methods that we have studied in this subject.
Question 2: Optimization [16 marks]
Consider the following loss function for the k-means clustering algorithm, where mj is a current cluster centroid and Cj refers to the collection of instances that are closest to mj:
k
L = 工 工 (xi− mj)2
j=1 xi∈Cj (3)
(a) We aim to minimize the above loss function L with gradient descent algorithm for a single cluster Ck . Derive the update formula for parameter mk with learning rate η . (N.B. Use batch gradient descent and show your complete mathematical working) [5 marks]
(b) Assuming we have selected an appropriate learning rate and want to compare how the loss function
changes when we use batch gradient descent as opposed to stochastic gradient descent algorithm. Both algorithms converge to an optimal solution after a number of iterations. Draw two diagrams showing how the value of the loss function changes for batch gradient descent and stochastic gradient descent algorithms. Explain and compare the graphs by referring to the mechanics of these two algorithms (N.B. label the axes for your two diagrams appropriately) [6 marks]
(c) Discuss a scenario where you would select stochastic gradient descent instead of the batch gradient descent? [1 mark]
(d) How can you detect if you have set the learning rate too low or too high by looking at the diagrams you drew in part (b)? What would the problem be with a high or low learning rate? [4 marks]
Question 3: Feature Selection [9 marks]
In the following dataset, each row indicates a short document d and is assigned a class label y categorising the text into financial (1) or non-financial(0). The values in the table show the number of times t the terms (Receipt, Salary, Commons, Daily) have occurred in the text. N.B. Calculations up to two decimal points and use log2. You can consider 0log0=0. You must show your mathematical work.
|
ID |
Receipt |
Salary |
Commons |
Daily |
y |
|
1 |
55 |
10 |
100 |
10 |
1 |
|
2 |
20 |
0 |
20 |
10 |
0 |
|
3 |
45 |
25 |
75 |
10 |
1 |
|
4 |
33 |
20 |
50 |
5 |
1 |
|
5 |
10 |
15 |
0 |
5 |
1 |
|
6 |
50 |
5 |
75 |
10 |
1 |
|
7 |
25 |
1 |
0 |
5 |
0 |
|
8 |
5 |
0 |
1 |
10 |
0 |
(a) Discretize Salary feature into two equal-frequency bins [2 marks]
(b) Discretize Salary feature into two equal-width bins [2 marks]
(c) Compute the Mutual Information (MI) of the word Salary after equal-frequency discretization in part (a) with the class label. [3 marks]
(d) Provide an example scenario where you would prefer equal-frequency binning over equal-width binning and justify your answer (1-2 sentences) [2 marks]
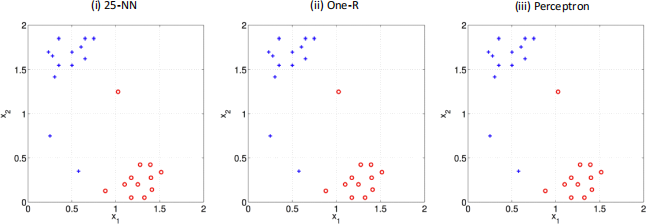
Question 4: Decision Boundaries [6 marks]
Consider a binary classification task where we aim to learn a function that maps a 2-dimensional input to classes {1, −1}. Training instances belonging to class 1 and −1 are denoted by 12 red circles and 13 blue crosses respectively (25 in total). For each of the following learning algorithms, draw the decision boundary on the given training dataset and justify your solution and each decision boundary in 1-2 sentences. (i) 25 nearest neighbours, (ii) One-R regression (iii) Perceptron [6 marks] (N.B. You can copy the image and draw the boundaries in your word/PDF document. Word has a draw option or use applications such as Preview and Markup (Mac users) . You may also copy the plots (approximately) onto your answer sheet, rather than annotating the exercise sheet directly if that is easier.)
Question 5: Active and Semi-supervised Learning [6 marks]
Consider the following classification results for a dataset that contains 2D data points. The linear classifier is learned by a Perceptron and the function is shown in the figure. The points E , F , G and H, are labelled and the labels are: YE = −1, YF = −1, YG = 1, YH = 1 . The labels of points A, B , C and D are unknown.
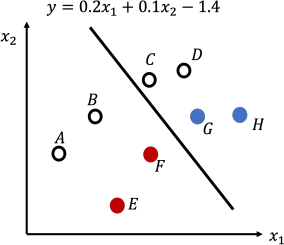
(a) Suppose you want to leverage active learning to train the model. Which one of the four unlabelled
points (A, B , C and D) will you first choose to query the label? Justify your answer. Hint: No calculation is needed. [3 marks]
(b) Suppose you want to leverage semi-supervised learning to train the model. Which one of the four
unlabelled points (A, B , C and D) will you first choose to predict labels using the classifier? Justify your answer. Hint: No calculation is needed. [3 marks]
Question 6: Neural Network [15 marks]
In the following two-class dataset, X1 and X2 are the input features of the data, and Y is the output class.
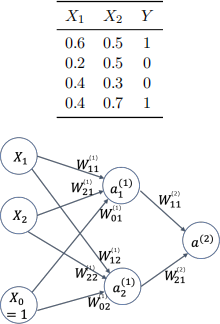
(a) You build a multilayer Perceptron (MLP) to classify the data - shown above. X0 is the bias node
at the input, which is set to 1 and for simplicity, there is no bias node added to the hidden layer. a ![]() and a
and a![]() are two units in the hidden layer. a(2) is the output unit. The activation functions g of the hidden layer and output layer are Sigmoid function, i.e., g(x) =
are two units in the hidden layer. a(2) is the output unit. The activation functions g of the hidden layer and output layer are Sigmoid function, i.e., g(x) = ![]() . All the parameters of the MLP are initialized as 1. What is the output of this MLP on the data point [X1=0.7,X2=0.5, Y=1]? [4 marks] (N.B. Show your work and provide the values of the hidden units to obtain the output value . Round your calculation by three decimal digits .)
. All the parameters of the MLP are initialized as 1. What is the output of this MLP on the data point [X1=0.7,X2=0.5, Y=1]? [4 marks] (N.B. Show your work and provide the values of the hidden units to obtain the output value . Round your calculation by three decimal digits .)
(b) This model is not optimal for classification on this dataset. Explain why and how this model can
be improved before any training is conducted. [3 marks]
(c) Reduce the model complexity described above in (a) by eliminating the hidden layer and keeping the activation functions. Draw the modified model and separate the weighed sum function s(x) from the activation function a(x). Use yˆ notation as the output variable. [1 mark]
(d) From the model described in question (c) and a loss function L = ![]() (Y − a(2))2 , using the chain rule, what is the update function for the weights in terms of Y ,
(Y − a(2))2 , using the chain rule, what is the update function for the weights in terms of Y , ![]() and x? Show your working out and all relevant formulas. [7 marks] Hint: the derivative of the Sigmoid activation function g\ (x) = g(x)(1 − g(x))
and x? Show your working out and all relevant formulas. [7 marks] Hint: the derivative of the Sigmoid activation function g\ (x) = g(x)(1 − g(x))
Question 7: Decision Trees [18 marks]
In the following table, we have 9 instances with 3 attributes X1 , X2 , X3 and a Class Label Y . Each row is showing an instance.
(N.B. Calculations up to two decimal points)
|
|
X1 |
X2 |
X3 |
Y |
|
1 |
5 |
0 |
1 |
1 |
|
2 |
6 |
1 |
0 |
1 |
|
3 |
2 |
0 |
0 |
1 |
|
4 |
2 |
0 |
1 |
2 |
|
5 |
1 |
1 |
0 |
2 |
|
6 |
3 |
0 |
1 |
2 |
|
7 |
4 |
1 |
1 |
3 |
|
8 |
6 |
1 |
0 |
3 |
|
9 |
3 |
1 |
0 |
3 |
(a) Treat the value of X1 as 6-way discrete categories. Calculate the information gain and gain ratio
of X1 feature on the dataset. [8 marks] (N.B. use log2 to compute the results of each step .)
(b) Treat the value of X1 as numerical and discretize them into three equal-width bins. Calculate the
information gain and gain ratio of X1 feature on the dataset. [8 marks] (N.B. use log2 .)
(c) Compare the values of gain ratio and information gain from the results of (a) and (b), what can you conclude in relation to the branching factor? [2 marks]
Section C: Design and Application Questions [22 marks]
In this section, you are asked to demonstrate that you have gained a high-level understanding of the methods and algorithms covered in this subject and can apply that understanding. Expect your answer to each question to be from one-third of a page to one full page in length. These questions will re- quire significantly more thought than those in Sections A–B, and should be attempted only after having completed the earlier sections.
Question 8: Sentiment Analysis [22 marks]
You joined a large social media company as a data scientist, and your first task is to design a system which labels social media posts as to the sentiment they contain(i.e., positive, negative, or neutral). Each post is represented as an “embedding” (i.e., a real-valued vector representation with 50 dimensions). This transformation has been applied consistently to every post. In addition to this text representation, each post is associated with the following features:
• Age of the author (numeric)
• Number of Likes (numeric)
• Number of re-posts (numeric)
• Gender of the author (male, female)
You have access to a labelled data set, which was created by showing a set of 100 posts with associated features to an expert, who labelled the posts’sentiments. In addition, you have access to a very large set of unlabelled social media posts, associated with the features listed above.
(a) Using only the labelled data, for each of the following algorithms, (a) indicate whether it is appro-
priate to use and (b) justify your decision. [2.5 marks]
– Decision Tree
– Categorical Naive Bayes
– Linear Regression
– 50-nearest neighbor
– K-means (K=3)
(b) Using only the labelled data, you ultimately decide to design a Multi-layer Perceptron (MLP).
Answer the following questions by referring to the problem description: [4 marks]
b.1 How many input units and output units would your MLP have?
b.2 Would your MLP have hidden units? Justify your answer.
b.3 What would be the activation function of the final layer?
b.4 What learning algorithm would you use? Justify your choice.
(c) Considering your training set size(n = 100) how would you evaluate your MLP model, making sure that you obtain a reliable estimate of its generalization performance? Describe all steps of your chosen evaluation strategy. [4 marks]
(d) After evaluation, performance is not quite satisfactory. You want to improve model performance using the available resources mentioned above. (1) Select an appropriate method to improve the model performance and justify your choice. (ii) Explain the algorithm in the context of this data set. (iii) Justify any settings of the algorithm you may need to decide on. [5 marks]
(e) Describe (1) a source of human bias and (2) a source of data bias that could impact the validity of
your model. Explicitly refer to the scenario of the question. (3) How would you ensure that your model does not reflect or amplify any of these biases? [6.5 marks]
2023-05-31