Stat 161 Practice Final 1
Hello, dear friend, you can consult us at any time if you have any questions, add WeChat: daixieit
Stat 161 Practice Final 1
1) Here are boxplots of the points scored during the first 10 games of the basketball season for both Caroline and Alexandra. The coach can take only one player to the state championship. Which one should she take, knowing that she would like a safe player?
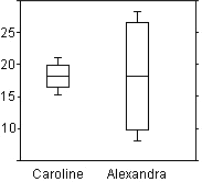
A) Alexandra, because she is the more consistent player.
B) Either of them, because both girls have a median score of about 18 points per game.
C) Caroline, because she is the more consistent player.
D) Caroline, because her IQR is the largest.
E) Alexandra, because her IQR is the largest.
2) The contingency table below provides a joint frequency distribution for a random sample of patients at a hospital classified by blood type and sex.
Blood Type
|
Sex |
O |
A |
B |
AB |
Total |
|
|
F |
105 |
85 |
24 |
11 |
225 |
|
|
M |
72 |
74 |
15 |
4 |
165 |
|
|
Total |
177 |
159 |
39 |
15 |
390 |
|
If a person is selected at random from the sample, what is the probability that the person has blood type A or is female?
A) 0.985
B) 0.767
C) 0.378
D) 0.535
E) 0.218
3) A study conducted at a certain college shows that 61% of the school's graduates find a job in their chosen field within a year after graduation. Find the probability that among 6 randomly selected graduates, at least one finds a job in his or her chosen field within a year of graduating.
A) 0.3660
B) 0.9965
C) 0.9485
D) 0.0035
E) 0.1667
4) A couple plans to have children until they get a boy, but they agree that they will not have more than four children even if all are girls. Create a probability model for the number of children they will have. Assume that boys and girls are equally likely.
A) Children ![]() 1
1 ![]() 2
2 ![]() 3
3 ![]() 4 P(Children)
4 P(Children) ![]() 0.5 0.25 0.125 0.125
0.5 0.25 0.125 0.125
B) Children ![]() 1
1 ![]() 2
2 ![]() 3
3 ![]() 4
4 ![]() 5 P(Children)
5 P(Children) ![]() 0.5 0.25 0.125 0.0625 0.0625
0.5 0.25 0.125 0.0625 0.0625
C) Children ![]() 1
1 ![]() 2
2 ![]() 3 P(Children)
3 P(Children) ![]() 0.5 0.25 0.25
0.5 0.25 0.25
D) Children ![]() 1
1 ![]() 2
2 ![]() 3
3 ![]() 4 P(Children)
4 P(Children) ![]() 0.5 0.25 0.125 0.0625
0.5 0.25 0.125 0.0625
E) Children ![]() 1
1 ![]() 2
2 ![]() 3
3 ![]() 4 P(Children)
4 P(Children) ![]() 0.25 0.25 0.25 0.25
0.25 0.25 0.25 0.25
5) Consider a game where the following is the probability distribution of your winnings:
|
Winnings |
- 1 |
0 |
1 |
5 |
|
Probability |
0.5 |
0.2 |
0.2 |
0.1 |
Respectively, what are the expected value and standard deviation of your winnings on a single play of the game?
A) 1.25 and 1.78
B) 0.20 and 1.78
C) 1.25 and 3.16
D) 0.20 and 3.16
E) 1.25 and 2.28
6) When a truckload of oranges arrives at a packing plant, a random sample of 125 is selected and examined. The whole truckload will be rejected if more than 8% of the sample is unsatisfactory. Suppose that in fact 10% of the oranges on the truck do not meet the desired standard. What is the probability that the shipment will be rejected?
A) 0.7734
B) 0.8155
C) 0.4532
D) 0.1845
E) 0.2266
7) A study involves 673 randomly selected deaths, with 34 of them caused by accidents. Construct a 98% confidence interval for the percentage of all deaths that are caused by accidents.
A) (3.40%, 6.71%)
B) (3.66%, 6.45%)
C) (3.8%, 6.4%)
D) (2.87%, 7.23%)
E) (3.09%, 7.02%)
8) A researcher wishes to estimate the proportion of fish in a certain lake that is inedible due to pollution of the lake. How large of a sample should be tested in order to be 99% confident that the true proportion of inedible fish is estimated to within 6%?
A) 188
B) 461
C) 376
D) 267
E) Not enough information is given.
9) A university wants to increase its retention rate of 4% for graduating students from the previous year. After implementing several new programs during the last two years, the university re-evaluated its retention rate using a random sample of 352 students and found the retention rate at 5%. Test an appropriate hypothesis and state your conclusion using α = 0.05. Be sure the appropriate assumptions and conditions are satisfied before you proceed.
A) H0 : p = 0.04; HA : p > 0.04; z = 0.96; P-value = 0.1685. There is not enough evidence that more than 4% of students are retained; the university should not continue with the
new programs.
B) H0 : p = 0.04; HA : p < 0.04; z = 1.07; P-value = 0.8577. This data shows conclusive evidence that more than 4% of students are retained; therefore, the university should continue with the new programs.
C) H0 : p = 0.04; HA : p < 0.04; z = - 1.07; P-value = 0.8577. There is not enough evidence that more than 4% of students are retained; the university should continue with the new programs.
D) H0 : p = 0.04; HA : p > 0.04; z = - 1.07; P-value = 0.1423. There is not enough evidence that more than 4% of students are retained; the university should not continue with the new programs.
E) H0 : p = 0.04; HA : p ≠ 0.04; z = 1.07; P-value = 0.2846. There is not enough evidence that more than 4% of students are retained; the university should not continue with the new programs.
10) In a survey of 1,000 television viewers, 40% said they watch network news programs. For a 90% confidence level, the margin of error for this estimate is 2.5%. If we want to be 99% confident, how will the margin of error change?
A) Since more confidence requires a narrower interval, the margin of error will be larger.
B) Since more confidence requires a narrower interval, the margin of error will be smaller.
C) Since more confidence requires a wider interval, the margin of error will be larger.
D) Since more confidence requires a wider interval, the margin of error will be smaller.
E) There is not enough information to determine the effect on the margin of error.
11) Among a sample of 100 students selected at random from one college, the mean number of siblings is 1.4 with a standard deviation of 1.3. Find a 95% confidence interval for the mean number of siblings for all students at this college.
A) (1.08, 1.73)
B) (1.36, 1.44)
C) (61.8, 66.2)
D) (1.14, 1.66)
E) (1.24, 1.44)
12) It has been reported that at least 5% of Americans have seen a UFO. A skeptical paranormal researcher believes this is not true and that the proportion of Americans that have seen a UFO is actually less than 5%. If you were to carry out a test, identify the Type II error in this context.
A) The error of rejecting the claim that the true proportion is less than 5% when it really is less than 5%.
B) The error of failing to reject the claim that the true proportion is at least 5% when it is actually less than 5%.
C) The error of accepting the claim that the true proportion is at least 5% when it really is at least 5%.
D) The error of rejecting the claim that the true proportion is at least 5% when it really is at least 5%.
E) The error of accepting the claim that the true proportion is at least 5% when it is actually less than 5%.
13) The seller of a loaded die claims that it will favour the outcome of 6. We don't believe that claim, and roll the die 350 times to test an appropriate hypothesis. Our P-value turns out to be 0.01. Provide an appropriate conclusion using α = 0.05.
A) We can say there is a 1% chance of not seeing a fair die in the results we observed from natural sampling variation. We conclude the die is loaded.
B) If the null hypothesis is true, then there is only a 1% chance of seeing a sample proportion of the outcome 6 as high (or higher) than that which we observed from natural sampling variation. At α = 0.05, we reject the null hypothesis and conclude that
the die will favour the outcome 6.
C) If the null hypothesis is true, then there is only a 1% chance of seeing a sample proportion of the outcome 6 as high (or higher) than that which we observed from natural sampling variation. At
α = 0.05, we fail to reject the null hypothesis that the die does not favour the outcome 6. That is, there is insufficient evidence to conclude that the die will favour the outcome 6.
D) There is a 1% chance of a fair die.
E) There is a 99% chance of a fair die.
14) A survey of randomly chosen adults found that 30 of the 64 women and 49 of the 74 men follow regular exercise programs. Construct a 95% confidence interval for the difference in the proportions of women and men who have regular exercise programs.
A) (-0.356, -0.030)
B) (-0.387, 0.631)
C) (-0.387, 0.662)
D) (0.306, 0.631)
E) (0.276, 0.662)
15) A poll reported that 30% of 60 Canadians between the ages of 25 and 29 had started saving money for retirement. Of the 40 Canadians surveyed between the ages of 21 and 24, 25% had started saving for retirement. Carry out an appropriate hypothesis test and see whether there is any difference between the proportions of Canadians between the ages of 25 and 29 and the ages of 21 and 24 who had started saving for retirement.
A) P-value = 0.5824; There is about a 58.24% chance that the two proportions are equal.
B) P-value = 0. 1812; If there is no difference in the proportions, there is about a 18. 12% chance of seeing the observed difference or larger by natural sampling variation.
C) P-value = 0.2912; There is about a 24.96% chance that the two proportions are equal.
D) P-value = 0.2912; If there is no difference in the proportions, there is about a 24.96% chance of seeing the exact observed difference by natural sampling variation.
E) P-value = 0.5824; If there is no difference in the proportions, there is about a 58.24% chance of seeing the observed difference or larger by natural sampling variation.
16) A marketing survey involves product recognition in Ontario and British Columbia. Suppose the proportion of Ontario residents who recognized a product is p1 and the proportion of British Columbia residents who recognized the product is p2 . The survey found a 98% confidence interval for p1 – p2 is (-0.023, -0.019). Give an interpretation of this confidence interval.
A) We know that 98% of British Columbia residents recognized the product between 1.9% and 2.3% more often than Ontario residents.
B) We know that 98% of Ontario residents recognized the product between 1.9% and 2.3% more often than British Columbia residents.
C) We are 98% confident that the proportion of British Columbia residents who recognized the product is between 1.9% and 2.3% higher than the proportion of Ontario residents who recognized the product.
D) We know that 98% of all random samples done on the population will show that the proportion of British Columbia residents who knew the product is between 1.9% and 2.3% higher than the proportion of Ontario residents who knew the product.
E) We are 98% confident that the proportion of Ontario residents who recognized the product is between 1.9% and 2.3% higher than the proportion of British Columbia residents who recognized the product.
17) Find the P-value for a t-distribution with 24 degrees of freedom for a t-value less than 1.76.
A) P-value is between 0.025 and 0.05
B) P-value is between 0.05 and 0.1
C) P-value is between 0.90 and 0.95
D) P-value is between 0.95 and 0.975
E) P-value is between 0.975 and 1
18) Suppose the proportion of first-year students at a particular university who purchased used textbooks in the past year is p1 and the proportion of second-year students at the university who purchased used textbooks in the past year is p2 . A study found a 95% confidence interval for p1 – p2 is (0.237, 0.421). Does this interval suggest that first-year students are more likely than second-year students to buy used textbooks? Explain.
A) Yes. Since both numbers are positive, there is evidence that first-year students are as likely as second-year students to buy used textbooks.
B) Yes. Since both numbers are positive, there is evidence that first-year students are more likely than second-year students to buy used textbooks.
C) No. Since both numbers are positive, there is no evidence that first-year students are more likely than second-year students to buy used textbooks.
D) No. Since both numbers are positive, we cannot tell whether there is evidence that first- year students are more likely than second year-students to buy used textbooks or second-year students are more likely than first-year students to buy used textbooks.
E) No. Cannot make any suggestion based on just a confidence interval.
19) You want to see if the number of minutes cell phone users use each month has changed from its mean of 120 minutes from 2 years ago. You take a random sample of 100 cell phone users and find an average of 135 minutes used. Set up your hypotheses.
A) H0 : μ = 135;
B) H0 : μ = 120;
C) H0 : μ = 120;
D) H0 : μ = 120;
E) H0 : μ = 135;
HA : μ > 135
HA : μ > 120
HA : μ ≠ 120
HA : μ < 120
HA : μ ≠ 135
20) A large software company gives job applicants a test of programming ability, and the mean for the test has been 160 in the past. Twenty-five applicants are randomly selected from one large university and they produce a mean score of 165, with a standard deviation of 13. At a significance level of 0.05, does this indicate that the population mean score is greater than 160?
A) Yes. With a P-value less than 0.005, we reject H0 : μ = 160. There is sufficient evidence that the population mean score is greater than 160.
B) No. With a P-value between 0.005 and 0.01, we fail to reject H0 : μ = 160. There is not sufficient evidence that the population mean score is greater than 160.
C) No. With a P-value between 0.9 and 0.95, we fail to reject H0 : μ = 160. There is not sufficient evidence that the population mean score is greater than 160.
D) Yes. With a P-value between 0.025 and 0.05, we reject H0 : μ = 160. There is sufficient evidence that the population mean score is greater than 160.
E) No. With a P-value greater than 0.1, we fail to reject H0 : μ = 160. There is not sufficient evidence that the population mean score is greater than 160.
21) A sociologist develops a test to measure attitudes about public transportation. She wishes to compute a 90% confidence interval for the mean score on this test. It is believed that the standard deviation for these test scores will be 21. How many people should be given the test in order to achieve a margin of error of 10?
A) 11
B) 14
C) 12
D) 15
E) 13
22) Ten different families are tested for the number of litres of water a week they use before and after viewing a conservation video. The summary statistics for each sample are provided below.
|
Summary statistic |
Before |
After |
Pooled |
Differences |
|
Average |
35.8 |
31.0 |
|
4.8 |
|
Standard Deviation |
3.43 |
3.53 |
3.48 |
5.25 |
NOTE: Please note that the third column summarize the differences from the original observations. By choosing a test, you will be using certain column(s) of the above table, NOT all of them.
Do the data suggest that, on average, the amount of water used after the viewing differs from the amount of water used before the viewing? Perform an appropriate test at the 5% significance level. (If you think the samples are independent, then do not assume equal variances.)
A) P-value is less than 0.01, so the data provide sufficient evidence to conclude that, on average, the amount of water used after the viewing differs from the amount of water used before the viewing.
B) P-value is less than 0.02, so the data provide sufficient evidence to conclude that, on average, the amount of water used after the viewing differs from the amount of water used before the viewing.
C) P-value is between 0.02 and 0.05, so the data provide sufficient evidence to conclude that, on average, the amount of water used after the viewing differs from the amount of water used before the viewing.
D) P-value is between 0.02 and 0.05, so the data do not provide sufficient evidence to conclude that, on average, the amount of water used after the viewing differs from the amount of water used before the viewing.
E) P-value is between 0.05 and 0. 1, so the data do not provide sufficient evidence to conclude that, on average, the amount of water used after the viewing differs from the amount of water used before the viewing.
23) The Better Cookie Company claims its chocolate chip cookies have more chips than another chocolate chip cookie. 120 Better Cookies and 100 of the other type of cookie were randomly selected and the number of chips in each cookie was recorded. The results are as follows.
Better Another Pooled
Mean number of chips 7.6 6.9
Standard deviation 1.4 1.7 1.543
State the hypothesis to test the claim that the population of Better Cookies has a higher mean number of chips.
A) H0 : μB – μA > 0
B) H0 : μB – μA > 0
C) H0 : μB – μA = 0
D) H0 : μB – μA = 0
E) H0 : μB – μA = 0
HA : μB – μA = 0
HA : μB – μA < 0
HA : μB – μA ≠ 0
HA : μB – μA < 0
HA : μB – μA > 0
24) Refer to the previous question, at the 2.5% level of significance; test the claim that the population of Better Cookies has a higher mean number of chips. (If you think the samples are independent, then assume equal variances.)
A) P-value is less than 0.005, so there is sufficient evidence to support the claim that the population of Better Cookies has a higher mean number of chips.
B) P-value is less than 0.005, so there is not sufficient evidence to support the claim that the population of Better Cookies has a higher mean number of chips.
C) P-value is between 0.01 and 0.025, so there is sufficient evidence to support the claim that the population of Better Cookies has a higher mean number of chips.
D) P-value is between 0.025 and 0.05, so there is not sufficient evidence to support the claim that the population of Better Cookies has a higher mean number of chips.
E) P-value is greater
2023-05-25