FIT 5147 Data Exploration
Hello, dear friend, you can consult us at any time if you have any questions, add WeChat: daixieit
FIT 5147 Data Exploration
1. Project Title: Exploratory Analysis of NBA Data
2. Introduction
In this REPORT, I focus on 3 issues:
a) How has the three-point shot changed the way NBA teams play the game, and what are the implications for team strategy and player performance?
b) How do NBA players' statistics and salaries correlate with each other? How different positions are compensated?
c) What is the relationship between a player's usage rate and their team's success in the NBA?
The motivation of these problem is to use data to make a more rational and objective assessment of the success of teams and players.
3. Data Wrangling
· Data source: Basketball-reference
· URL: https://www.basketball-reference.com
· Wrangling steps
i. Find the data you need to use, e.g. team stats (three-point percentage, number of three-point attempts, etc.)
ii. Use the functions that come with the data source to remove unwanted rows and columns before exporting the data. For example, I only studied the change in the number of threes since the 2012-2013 season, removing data from previous seasons.
iii. Sort the data collected in excel, e.g. divide the teams by East and West.
4. Data Checking
As basketball-reference is a public and frequently used website, the data here is very complete and clean, so I need to judge more on its correctness.
· First, I compared the data from this site with the data from the official NBA website to verify the accuracy of the data.
· Next, read the obtained data in tableau. to see if there is any missing data and if the data is continuous. In this step, I found that the Charlotte Hornets, due to a team name change in the interim, had their data missing, so I found the data for the team's predecessor, the Charlotte Bobcats, to fill in my data set.
· Finally, it is a process of checking the visual graphs as they are drawn to see if any unreasonable values appear and then analysing them accordingly around the abnormal values.
5. Data Exploration
a. How has the three-point shot changed the way NBA teams play the game, and what are the implications for team strategy and player performance?
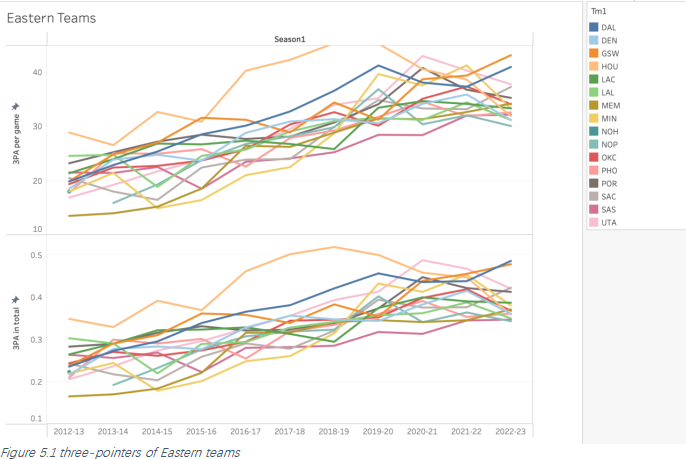
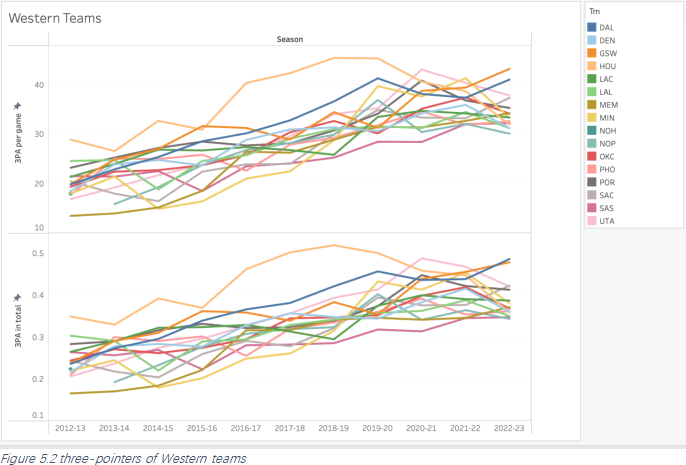
· Figures 5-1 and 5-2 both contain two parts, 3PA in total (3-point attempts as a percentage of total shots, and 3PA per game. Two main reasons led me to choose these two figures as the judging criteria:
Firstly, due to the epidemic and not being able to play a full 82 games every season. Secondly some rule changes happened during the last decade (such as teams only getting 14 seconds of offense after grabbing an offensive rebound instead of the previous 24 seconds) have led to faster-paced games and more rounds.
Therefore, simply looking at the number of 3-point attempts does not give an accurate trend, so I used Tableau's own calculate field function to calculate the original team shot data to get the figures in Figures 5-1 and 5-2.
· In the graph we can clearly see the change in the trend of teams' 3PA p er game and 3PA: almost all teams are increasing the number of 3-point shots per game, while the increase in the percentage of 3-pointers in the total number of shots is an indication that the tactical strategy of the teams is more inclined to get 3-point shots.
b. How do NBA players' statistics and salaries correlate with each other? How different positions are compensated?
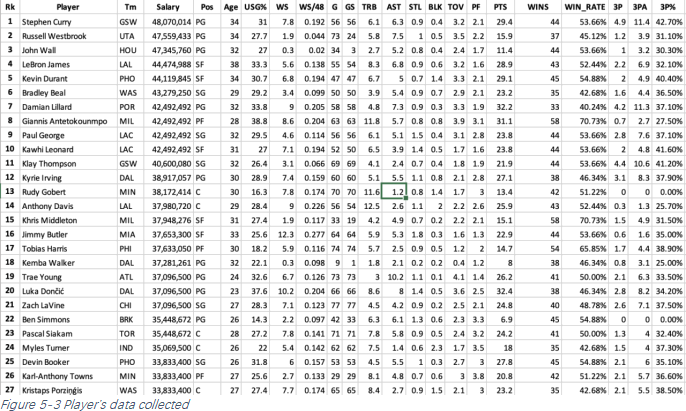
In this part I wrangled the data as is shown in Figure 5-3, I collect these data from different pages, so the rank of their names is a big challenge, and via the ‘MATCH’ function in Excel, I finally put them together successfully, and since some player played at different teams during the season, I also delete the duplicated part in my tabular.
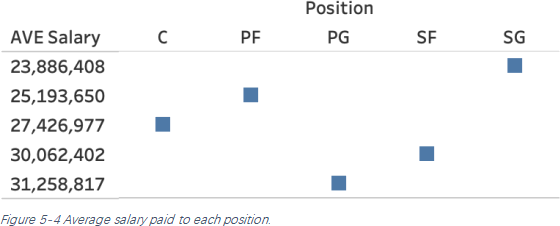
Based on my data, I categorized the players according to their position and calculated their average salary, the results are shown in Figure 5-4. As we can see from the graph, Point Guard currently has the highest average salary. The Shooting Guard has the lowest salary.
By studying (Bianchi, F., Facchinetti, T., & Zuccolotto, P, 2017) the main responsibilities of each position in the NBA, I learnt that Point Guard is responsible for more ball handling duties on the court, including carrying the ball across the half court, controlling the pace of the game, organising the offense, etc. This position requires better basic skills, good vision and a cool head in order for them to help their team stay on track. In the case of the Shooting Guard, their main task is to shoot, for example, like Reggie Leigh and Klay Thompson, they don't always have the responsibility of holding the ball, but rather to run actively without the ball to find the open space and to catch the opponent's defensive slack to deliver the killer blow.
Based on this analysis, we can surmise that NBA teams are now favouring players with the ability to hold the ball, attack and score on their own, rather than scorers who rely on their teammates to create opportunities.
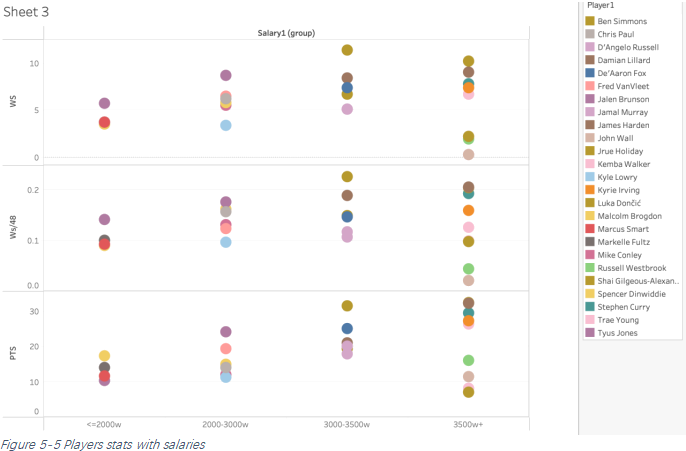
I've done a lot of exploring the link between player salary and player data, and Figure 5-5 is a few use cases from that exploration, using a number of basic stats including points, rebounds, assists, and advanced stats like ws(Win share) values, and using Filter to filter out players who have declined badly in recent years but are still on high paying contracts (e.g. John Wall). John Wall, for example). In the end, however, I didn't find a significant link between the two.
Such a phenomenon seems to be at odds with our usual perception that higher level players should usually be paid more. Therefore, I have researched the NBA salary system and through my research, I believe the biggest influence on this phenomenon is the salary cap. (Goldrosen, J. M., 2018) The existence of a salary cap sets a maximum cap on a team's budget, and once this cap is exceeded, the team is required to pay a tax to the league. The higher the excess, the higher the rate of payment. At the same time, the most relevant reason for my observation would be that the existence of the salary cap limits the maximum salary a team can pay a player, for example a team can only pay a player up to 35% of the salary cap. Under such a system, suppose both Player A and Player B are paid $30 million, but behind this, there could be a situation where Player A is indeed worth $30 million, but Player B is earning $30 million because the team can only pay him a maximum of $30 million.
c. What is the relationship between a player's usage rate and their team's success in the NBA?
(Page, G. L., Barney, B. J., & McGuire, A. T., 2013) A player's usage rate takes into account the number of times they take a shot, make an assist, or commit a turnover during a possession. A high usage rate indicates that a player is heavily involved in their team's offensive strategy and is taking a larger share of the shots and making more plays than their teammates. It can also indicate that the player is relied upon to carry a significant portion of the team's offensive workload.
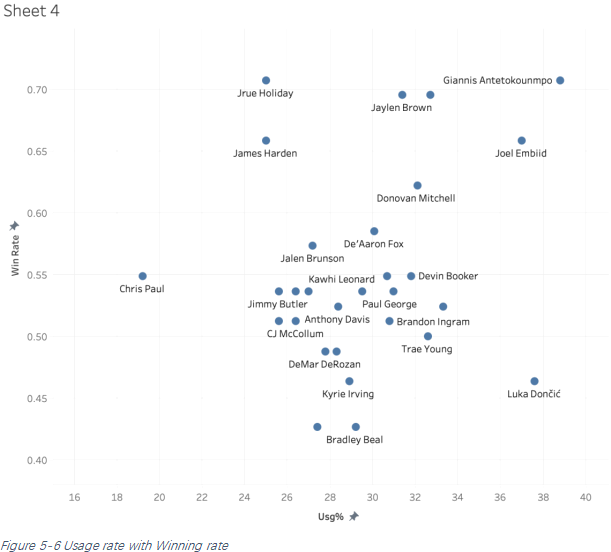
In Figure 5-6 we can see the relationship between player usage rate (Usg%) and team winning percentage. Generally, The more a player dominates the ball and takes shots, the more they can impact their team's scoring output. However, this can also lead to inefficiencies, such as missed shots, turnovers, and a lack of ball movement, which can ultimately hurt a team's chances of winning.
In this chart Giannis AntetoKounmpo has the highest USG% of 38.8%, indicating that he is heavily involved in his team's offense, but his team also has the highest WIN_RATE of over 70%, indicating that his style of play is effective in contributing to winning. On the other hand, Russell Westbrook has a similar USG% of 37.6%, but his team's WIN_RATE is only 46%, suggesting that his high usage rate may not be translating into wins as effectively.
In some ways, a player with a high usage rate can be considered the core of the team, the leader, and the team allocates such a high share of the ball to him because he is good enough, however, basketball is ultimately a team sport and the usage rate of one player alone does not fully determine the success of the team, for example, Steph Curry, the most successful player in the last decade, winning four championships and two MVP He has won the MVP twice, but his usage rate is usually only around 30%, which is lower than stars like Doncic and James. So the usage rate of the core players can somehow improve the team's bottom line, for example LeBron James, although they started the season with the worst record of almost all the teams, they eventually managed to make the playoffs with this core player leading the way. If a team wants to be successful (and win a championship), it needs to consider more factors, such as the level of understanding between players, the team's own tactical strategy, etc.
6. Conclusion
In this report I explored multiple and large number of data, and for the 3 questions I got these coclusions:
i. Three-point shooting has received more attention from all teams, both in terms of the average number of three-point attempts per game and the percentage of three-point attempts that make up the total number of attempts.
ii. Point guard generally be paid most nowadays, and Shooting guards are paid the least.
iii. Because of the existence of Salary Cap, We don't assume that players earning the same amount of money have the same level of ability.
iv. The usage rate of an individual player does not necessarily determine the success of a team, but it can be a consideration of the player's offensive responsibilities within the team.
7. Reflection
1) I learned the process of getting data and using existing tools to organize the data (delete or merge), but in the course of this assignment, I relied too much on the Basket-reference data source, which provides comprehensive and easy to understand data, but it is not convenient to get the data directly according to your needs, and you need to do a lot of subsequent merging and organizing, in the following attempts, I will use some API to manipulate the data
2) Learning to use Tableau for data visualisation, but it wasn't until the end that I realised that it was possible to use my own graphics for the visualisation process, such as Figure 5-6, where I could have the player's avatar displayed directly in the interface for a better visualisation.
8. Bibliography
Nourayi, M. (2019). Strategically driven rule changes in NBA: Causes and consequences. The Sport Journal, 22, 1-11.
Bianchi, F., Facchinetti, T., & Zuccolotto, P. (2017). Role revolution: towards a new meaning of positions in basketball. Electronic Journal of Applied Statistical Analysis, 10(3), 712-734.
Goldrosen, J. M. (2018). The Motivations and Effects of the NBA Salary Cap.
Page, G. L., Barney, B. J., & McGuire, A. T. (2013). Effect of position, usage rate, and per game minutes played on NBA player production curves. Journal of Quantitative Analysis in Sports, 9(4), 337-345.
2023-05-24