Stats 102A - Homework 5 Instructions
Stats 102A - Homework 5 Instructions
Reading
a. Comparing Groups - Chapters 6 (especially section 6.4), 7, 8, and 9 (skip 9.7 and 9.9)
Textbook available free for UCLA students: https://onlinelibrary.wiley.com/doi/book/10.1002/9781118063682
You must connect via the UCLA VPN for access.
b. Science Isn’t Broken - http://fivethirtyeight.com/features/science-isnt-broken
c. ASA’s 2016 statement on Statistical Significance and P-Values
http://amstat.tandfonline.com/doi/pdf/10.1080/00031305.2016.1154108?needAccess=true
Part 1
Read the two webpages linked above. Explain what a p-value is and how a researcher should use it. (150 words or less)
Part 2
Randomization test for numeric data
credit: David C. Howell
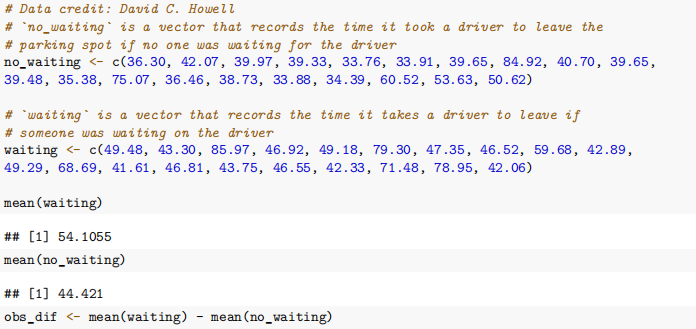
"When waiting to get someone’s parking space, have you ever thought that the driver you are waiting for is taking longer than necessary? Ruback and Juieng (1997) ran a simple experiment to examine that question. They observed behavior in parking lots and recorded the time that it took for a car to leave a parking place. They broke the data down on the basis of whether or not someone in another car was waiting for the space.
“The data are positively skewed, because a driver can safely leave a space only so quickly, but, as we all know, they can sometimes take a very long time. But because the data are skewed, we might feel distinctly uncomfortable using a parametric t-test. So we will adopt a randomization test.” – David C. Howell
Miles: Technically this is an observational study, but the assumption of exchangeability still holds. Whether someone is waiting for the driver or not can be assumed to be random and not related to the driver itself.
Thus, all permutations of the condition are equally likely and it is valid to use a randomization test.
Randomization test
Conduct a randomization test to test the hypothesis that there is no difference in average time for drivers who have a person waiting vs those who do not have a person waiting, against the alternative that drivers who have a person waiting will take longer than if they did not.
Be sure to calculate an empirical p-value and make the appropriate conclusion.
Comparison to traditional t-test
Conduct a traditional two-sample independent t-test. Compare the resulting p-value from the parametric t-test with the randomization test.
Part 3
Another Randomization test for numeric data
Textbook: Comparing Groups, Chapter 6, Exercise 6.1
Make sure you use the Comparing Groups textbook. Make sure you read the description of the experiment that generated the data on page 118 of the textbook.
Be sure to read the codebook which describes each variable.
Data: https://raw.githubusercontent.com/zief0002/comparing-groups/master/data/AfterSchool.csv
Data Codebook: https://github.com/zief0002/comparing-groups/blob/master/data-codebooks/AfterSchoolProgram. pdf
Exploratory Analysis
Carry out an exploratory analysis to initially examine whether there are treatment effects of the after-school program on victimization measures. You need only to find the summary statistics for the two groups and produce a side-by-side boxplot comparing the two groups.
Randomization Test
Use the randomization test to evaluate whether there is convincing evidence that the after-school program has an effect on victimization.
Be sure to calculate an empirical p-value and make the appropriate conclusion.
Part 4
The data is based on the following journal article, referenced by Samuels, et al.
Ware, J. H. (1989). Investigating therapies of potentially great benefit: ECMO. Statistical Science, 298-306. http://www.jstor.org/stable/2245829?seq=1#page_scan_tab_contents
Extracorporeal membrane oxygenation (ECMO) is a procedure that can be used to treat newborn babies who suffer from severe respiratory failure. An experiment was conducted in which 29 babies were treated with ECMO and 10 babies were treated with conventional medical therapy (CMT). The outcomes of this study are shown here:
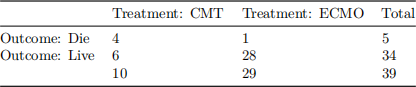
More recently, ECMO has also been used in adults with respiratory failure caused by COVID-19.
Randomization test
Perform a randomization test (with 10000 randomizations) to test if ECMO is more effective at saving the lives of newborn babies with respiratory failure. You’ll need to generate the vector of TRUE/FALSE values on your own.
Comparison to Fisher’s Exact Test
We did not cover this in lecture, but do a tiny bit of reading on Fisher’s exact test.
https://en.wikipedia.org/wiki/Fisher%27s_exact_test
https://stat.ethz.ch/R-manual/R-patched/library/stats/html/fisher.test.html
Use R’s fisher.test() function to conduct a Fisher exact test. How does your p-value of the Fisher Exact test compare to the results of the randomization test?
Part 5
Textbook: Comparing Groups, Chapter 7, Exercise 7.1
Be sure to read the codebook which describes each variable.
Data: https://raw.githubusercontent.com/zief0002/comparing-groups/master/data/HSB.csv
Data codebook: https://github.com/zief0002/comparing-groups/blob/master/data-codebooks/HSB.pdf
Non-parametric bootstrap test
Use a non-parametric bootstrap test to test if there is a difference in the variances of science scores, between public and private school students. 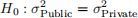
Make sure you calculate an empirical p-value and comment on the outcome.
You do not have to use package boot, but you are allowed to do so if you wish.
Parametric bootstrap test
Make a parametric assumption about the population of Science Scores. Use a parametric bootstrap test to test if there is a difference in the variances of science scores, between public and private school students. 
Make sure you calculate an empirical p-value and comment on the outcome.
You do not have to use package boot, but you are allowed to do so if you wish.
Part 6
Bootstrap hypothesis test for the speed of light.
In 1882 Simon Newcomb tried to measure the speed of light. He measured the time it took for light to travel from Fort Myer on the west bank of the Potomac River to a fixed mirror at the foot of the Washington monument approximately 3720 meters away. https://agupubs.onlinelibrary.wiley.com/doi/pdf/10.1029/2002EO000297
The values are recorded as deviations from 24800 nanoseconds. Thus a value of 28 means that Newcomb measured the time to travel to the mirror and back as 24828 nanoseconds.
He made 66 measurements, and the deviations are as follows:
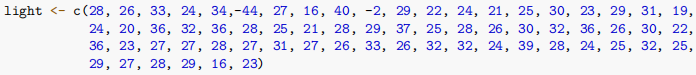
The modern accepted value for the time light travels the distance used in the experiment is 24833 nanosec-onds, or a deviation of 33.
Non-parametric bootstrap test
Perform a bootstrap test to see if Newcomb’s measurements are significantly different from the modern accepted value of 33.
● Hypotheses:

● The mean of this sample of data is 26.212.
● Add a constant to the vector light, so the vector is centered at 33. This simulates a population of data that is centered at the true mean but exhibits the same variation around the mean as Newcomb’s measurements.
● Perform bootstrap resampling (you might need 10ˆ5 repetitions) to see how often a random sample drawn from this population could produce a mean as extreme as the sample observed in our data.
You do not have to use package boot, but you are allowed to do so if you wish.
Non-parametric bootstrap test with outliers removed
Perform the bootstrap test again after removing the two negative outliers (-2, and -44) to see if the Newcomb’s measurements are significantly different from the modern accepted value of 33. Don’t forget to add a constant to the data (so the vector is centered at 33) after removing the outliers.
You do not have to use package boot, but you are allowed to do so if you wish.
2021-08-02