Financial Modelling – Final Assessment Task
Hello, dear friend, you can consult us at any time if you have any questions, add WeChat: daixieit
Financial Modelling – Final Assessment Task
Stock Price Crash Risk Measures
1 Background
Financial economists have a long history of investigating the stock price crash risk, which refers to the risk of experiencing large price depreciation for a stock. The stock price crash risk is usually measured by the return distribution asymmetry for a given period. Chen, Hong, and Stein (2001), Jin and Myers (2006), Hutton, Marcus, and Tehranian (2009), Kim, Li, and Zhang (2011a; 2011b), and Callen and Fang (2015) develop three main measures for the stock price crash risk, including negative skewness, down-to-up volatility, and net crash day frequency.
In this task, you must first calculate the three stock price crash risk measures based on daily firm-specific returns for six stocks, including GOOGL, AMZN, AAPL, FB, MSFT, and TSLA. Then, you are required to rank these stocks based on the first two measures, from the lowest to the highest.
Suppose Dit is the sequence of the firm-specific daily return for stock i in the period t, and n is the number of available daily returns in period t . Then the first crash measure, negative skewness for stock i in the period t (denoted as
NCSKEwit ), can be calculated as in Equation (1):
 (1)
(1)
Second, the down-to-up volatility is defined as the natural logarithm of the ratio of its downside volatility over upside volatility. Specifically, for stock i in the period t , the down-to-up volatility, denoted as DUV0Lit , can be calculated as in Equation (2):
 (2)
(2)
In Equation (2), nu is the number of daily returns above the period average return, and nd is the number of those below the average. Dit is the sequence of the firm-specific daily return for stock i in the period t .
The net crash day frequency, the third measure, aims to measure the actual stock price crashes, while the first two measures capture crashes through return distribution asymmetry. To calculate it, we need to first define a crash day as a daily firm-specific return that exceeds 3.09 standard deviations below the mean in the given period. Choosing 3.09 aims to generate a frequency of 0. 1% in the normal distribution. A jump day is defined similarly, as a daily firm-specific return exceeding 3.09 standard deviations over the mean. The net crash frequency count is then calculated using the number of crashes minus the number ofjumps for stock i in the period t .
2 Spreadsheet Guidance
You are provided the daily firm-specific returns of six stocks for a quarter in the spreadsheet named “SCRM” . The six stocks are GOOGL, AMZN, AAPL, FB, MSFT, and TSLA. With the given data of firm-specific returns, two functions have been (poorly) written in Module1, following the instructions in the Background session, to compute the three stock price crash risk measures and rank the stocks based on the first two measures calculated.
The following picture shows the area (in green) where you should execute the first function (crash_measure), which aims to calculate the three stock price crash risk measures:
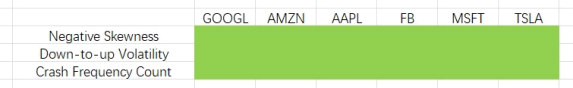
This function is aimed to output the three firm-specific stock price crash risk measures for the six stocks at once, which means that the output is a 3*6 matrix of numbers stored in an array. You need to press ENTER + SHIFT + CTRL to run the function if you use the Windows operating system. All the input you need for this function is the firm- specific stock daily returns.
The following picture shows the area (in green) where you should execute the second function (stock_rank), which aims to rank these stocks based on the first two
measures from the lowest to the highest:
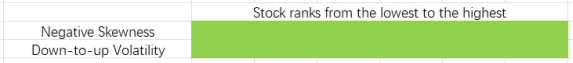
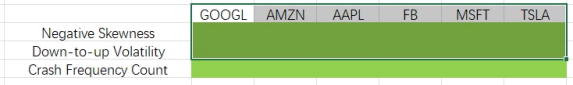
For this function, you are expected to have the stock ticker symbols (GOOGL, AMZN, etc.) in the green cells. This function is also aimed to output all the ranks at once. The output is a 2*6 matrix of strings stored in an array. You need to press ENTER + SHIFT + CTRL to run the function if you use the Windows operating system. The input for this function, shown in the following picture, is a 3*6 matrix with stock ticker symbols in the first row and your results from executing the first function in the following two rows:
3 Assessment
The code to create the required functions for this task is already provided to you in the Module1, but it was very poorly written and unable to proceed straightaway. Your job is to fix and improve the code.
You will be assessed across Week 11 and 12 on those criteria shown in the Marking Guide For Final Assessment, including the quality of your solutions and your ability to enter into an informative discussion.
Q and A in Week 11 (5 minutes):
Focused on your understanding of the idea (similar to a code plan), including but not limited to:
1. Demonstrate your understanding of the problem.
2. Outline the errors in the function.
3. Propose methods to improve the efficiency of the code.
4. Suggest recommendations on what you think may be done to optimise the function. Presentation in Week 12 (5 minutes):
Focused on the code and solution quality:
1. The quality of your code with respect to the general marking guide posted on Moodle. 2. Explain the issues and improvements you have made.
Spreadsheet submissions in Weeks 11 & 12:
1. The automatic marking software will mark the “SCRM” worksheet and the function. 2. You should not modify the structure of the “SCRM” worksheet or change the function name.
I look forward to seeing your work in weeks 11 and 12. Wishing you all the best!
References
Callen, J. L., & Fang, X. (2015). Religion and stock price crash risk. Journal of Financial and Quantitative Analysis, 169- 195.
Chen, J., Hong, H., & Stein, J. C. (2001). Forecasting crashes: trading volume, past returns, and conditional skewness in stock prices. Journal ofFinancial Economics, 61(3), 345–381.
Hutton, A. P., Marcus, A. J., & Tehranian, H. (2009). Opaque financial reports, R2, and crash risk. Journal ofFinancial Economics, 94(1), 67-86.
Jin, L., & Myers, S. C. (2006). R2 around the world: New theory and new tests. Journal ofFinancial Economics, 79(2), 257-292.
Kim, J. B., Li, Y., & Zhang, L. (2011). Corporate tax avoidance and stock price crash
risk: Firm-level analysis. Journal ofFinancial Economics, 100(3), 639-662.
Kim, J. B., Li, Y., & Zhang, L. (2011). CFOs versus CEOs: Equity incentives and crashes. Journal ofFinancial Economics, 101(3), 713-730.
2023-05-22
Stock Price Crash Risk Measures