Final Assessment: Spike Detection
Hello, dear friend, you can consult us at any time if you have any questions, add WeChat: daixieit
Final Assessment: Spike Detection
Background
The algorithm in front of you is used to detect spikes from time-series data. This algorithm uses moving averages and moving standard deviations to identify spikes. A spike is defined when a data point, Xt is greater than n × σt from ![]() t , where n is an integer,
t , where n is an integer, ![]() t and n × σt , are respectively the moving average and moving standard deviation.
t and n × σt , are respectively the moving average and moving standard deviation.
Recall from your basic statistics course that the Z score tells you how far a data point is from the mean in units of standard deviation (in our case, the mean and standard deviations are both moving, where the Z-score for Xt is calculated as:
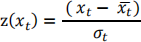
If the raw data point, Xt , is above (below) the mean then the Z-score is positive (negative). If Xt is equal to the mean, then the Z-score is 0. For example, a spike can be identified when the moving Z-score for Xt is greater than 3, which is the same as saying when Xt is greater than 3 × moving standard deviation from the moving mean. Again, 3 is just an arbitrary number and that number may not be ideal for all datasets.
The image below is an illustration of the algorithm (see Figure 1):

Figure 1: In the top panel, the blue trace is the raw time series data. The yellow race is the moving average based on a defined lag window. The purple trace is the moving standard deviation based on a defined lag window. In the bottom panel, the red lines are the spikes detected when the above mentioned conditions are true. A value of one is assigned when true and zero otherwise.
In neuroscience, an action potential (spike) from the same neuron cannot occur consecutively due to the absolute refractory period of a neuron (the membrane potential must reset before another action potential can fire again). In order to correct for the VALID number of spikes, you must calculate the time between spikes (also known as the interspike interval). For this assessment, it takes 50ms for the membrane potential to reset. Therefore, if a spike occurs at X0 , this same neuron cannot spike again until after 50ms from X0 . In the case that there are false positive spikes, you need to revert the signals back to 0.
Finally, for the purpose of the presentation, you must calculate the average inter-spike intervals starting from the very first spike from the list of valid spikes. You do not need to report this figure in the spreadsheet as we’ll discuss this in the presentation. ALL calculations but be completed in VBA.
Datasets
In this workbook, I’ve provided two sets of data:
1. The first is an electrophysiological recording of a single neuron. This is a common trace in neuroscience where it illustrates the change in electrical activity (measured in voltage) over time, with spikes denoting action potentials. Each data point represents 10ms.
2. The second is historical daily closing price data of the ASX200 index from 1992 to this week. In this case, spikes would denote abnormal daily returns.
Description of the function
The spike detection algorithm is called as a function and relies on 4 main inputs:
1. Time series data
2. Lag window (number of data points for the rolling average and standard deviation)
3. Threshold (n) – the number of moving standard deviations each observation is away from the moving average
4. A weight parameter – I’ll let you work this one out yourself (it’s somewhere in the code) and plays an important role in this algorithm.
The function MUST be called as follows:
=(Data, Lag, Threshold, Weight)
Assessment
You will be assessed across week 11 and 12 on the content, quality of your ideas/solutions and on
your ability to contribute to an intelligent and informed discussion.
Presentation and Q&A in week 11 (5 minutes)
This component focuses on your understanding of the idea (similar to a code plan). I want you to, but not limited to:
1. Demonstrate your understanding of the problem;
2. Outline the missing condition and identify the bugs and issues with the problem;
3. Present a decision tree on how you would isolate valid spikes - your decision tree should be descriptive to highlight the algorithmic processes;
4. Propose methods to improve the efficiency of the code - there are redundancies in the algorithm which slows it down; and
5. Suggest recommendations on what you think would be the optimal inputs for the ASX 200 sheet and why?
Presentation in week 12 (5 minutes)
This week focuses on your code and solution quality.
1. The algorithm is poorly written and presented. Your job is to fix and improve the code with respect to the general marking guide posted on Moodle - see the written communication section;
2. Implement the inter-spike interval calculations and output the final average as a message box.
3. Explain the issues and improvements you’ve made; and
4. Modify the ASX200 sheet to improve the usability of the sheet. Be creative and imagine you are designing this sheet for a client (me).
Spreadsheet submissions, Friday 11:55PM of Weeks 11 & 12
1. The automated marking software only marks the electrophysiological sheet – ensure that your function is correct and working;
2. You should not modify the structure of the electrophysiological sheet;
3. You should not output the inter-spike interval calculations anywhere - I only want this in VBA and presented in week 12; and
4. All your creative improvements on usability should be on the ASX200 sheet
Remember, the structure of how you want to present the information is completely up to you!
If you have any questions, feel free to post it on the discussion forum and I’ll respond either on the forum or in our email chain so everyone else can see.
I look forward to seeing your work in weeks 11 and 12.
2023-05-18