FIT9132 MO 2021 TP3 Supplementary Assessment
FIT9132 MO 2021 TP3 Supplementary Assessment
Due Sunday 11th July at 6 PM
Task 1 Modelling
The local state government has decided to change the manner in which garbage and recycling collections are charged to households and businesses. Previously all clients were charged a flat rate based on their property rate. The new approach will use onboard cart tipper truck scales to weigh each bin which is collected and clients will then be charged for the weight and type of collection made.
The following describes the data which is to be stored in a new "Collections" system to support this user pays by weight approach.
Garbage and recycling collections are managed by local authorities such as cities and shires. Each local authority is assigned an id, has a chief executive officer (given name and family name) and a contact telephone number. The type of authority is also recorded (this must be shire, city or borough). Each authority has responsibilities for the streets in their local authority area. Each street is assigned an id and has a recorded length in meters, particular road surface and number of lanes.
Properties are located on streets. A property has a property id and a street number. Each property has recorded the owners' contact details: name, email address and phone number. Each owner is assigned an owner id. For the purposes of the "collections" system, a property is only recorded as being owned by one owner. For each property, the system records when wheelie bins, of each type, are supplied/replaced (there are three types of bins supplied garbage, green and recycle). This data will help track misuse/theft of bins.
Collections schedules are created for each street – they are identified by a schedule id and include the frequency and type of the collection (for example recycle collections are made every second Friday). The type of collection will be garbage, green or recycle.
When a scheduled collection is made at a property a street collection id is generated. The collection date is recorded and the truck weighs and records the number of kilograms which were collected for that property in this collection.
Using LUCIDCHART (DO NOT USE SQL DEVELOPER) - Create a logical level diagram using Crow’s foot notations to represent the "Collections" data requirements described above. Clearly state any assumptions you make when creating the model. Be sure to include all attributes, including Primary Keys and Foreign Keys, as part of your design. You do not need to include indicators (*) to show if an attribute is required or not nor datatypes/sizes.
In LucidChart use the same diagram style as we have used for conceptual modelling, simply amend the approach to show a logical model.
In building your model you must conform to FIT9132 modelling requirements
Submission Requirement: A single PDF file called task1_bins.pdf of your model exported from LucidChart.
Task 2 Normalisation
A little league netball organises a competition for under-16 teams. Each team is graded according to their age bracket. Grade A is for the 15-16 years old and grade B for the 13-14 years old. Matches are organised for both grades and a match can have teams from different grades competing. At the end of the competition, the winner is determined for each grade. The competition runs for seven weeks and consists of eight teams. Each round, there are four matches scheduled on Saturday during the competition weeks. The following schedule shows some samples of the information about the matches.
COMPETITION SCHEDULE
Round 1, 12-June-2021
Round 2, 19-June-2021
etc
The database designer has included the team_id and umpire_id attributes in the database to uniquely identify teams and umpires in the competition.
The unormalised form (UNF) for this data has been selected as:
ROUND (round_no, match_date, (start_time, court_no, team1_id, team1_name, team1_grade, team2_id, team2_name, team2_grade, umpire_id, umpire_firstname, umpire_lastname, umpire_acc_level))
Convert this UNF to first normal form (1NF) and show all partial dependencies via dependency diagrams. Continue the normalisation to third normal form (3NF) showing dependencies as appropriate.
Do not add new attributes during the normalisation. Clearly write the relations in each step from the unormalised form (UNF) to the third normal form (3NF).
You may consolidate the relations after arriving at 3NF (if necessary).
Submission Requirement: A single PDF file called task2.pdf containing your full normalisation
Task 3 SQL
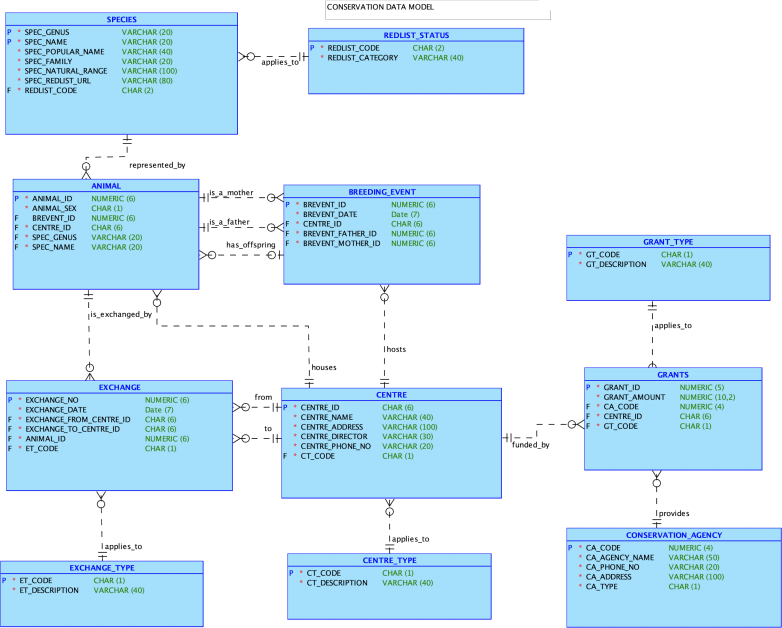
Using the case study and data model listed in Appendix A to write SQL to answer the following queries.
Note the required tables are available in the oracle database under the account cnsv ie you need to use, for example:
select * from cnsv.animal
1. How many animals, which have been born in the wild, belong to the EQUIDAE family.
Name the output column "Number of animals".
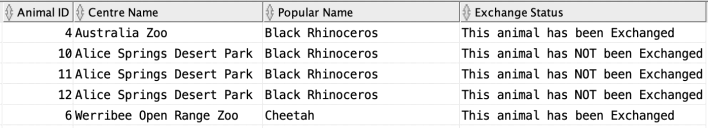
2. In a single list show all animals indicating if the animal has been exchanged or not - the list should show animal id, centre name, popular name, and an exchange status message, indicating if the animal has been exchanged or not.
The list should be in animal id order within popular name order. Your output should have the general form (sample rows only shown):
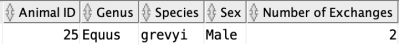
3. List the animal id, genus, species, sex and number of exchanges for those animals which have been involved in more than the average number of exchanges per animal (for those animals which have been exchanged). The animal sex must be displayed as 'Male" or 'Female'.
Your output should have the general form (sample row only shown):
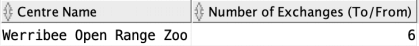
4. Which is the most popular centre for exchange to or from? Your output should list the centre name and the number of times the centre has been used for an exchange_from or an exchange_to. The exchange_from and the exchange_to will be calculated as a single figure. For example, if a centre is involved in an exchange as a recipient (exchange_to) and in another exchange as a provider (exchange_from) then this centre will be counted to have 2 exchange events. The list should be displayed in the order of the centre name.
Your output should have the general form (sample rows only shown):
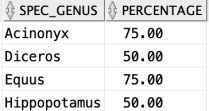
5. List the genus name, and the ratio of the animals born in the wild to the total animals for that genus in the database. Show the ratio as a percentage, round it to one decimal point. Order the list according to the genus name.
Your output should have the general form (sample rows only shown):
6. List all centres (centre id and name) that did not receive any grants. Order the list according to the centre name.
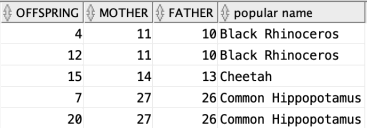
7. List all offspring born as a result of the various centres breeding programs. List the animal id of the offspring, the animal id of the mother, the animal id of the father and the popular name of the animal. Order the list according to the popular name.
Your output should have the general form (sample rows only shown):
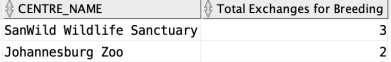
8. List the centre name and the number of times the centre has been involved in an exchange for a breeding program in the last two years. The centre involved in the exchange can be as a recipient or a provider for the animal exchange. The two years should be counted from the current date when the query is executed. The list should be ordered from the highest to the lowest number of exchanges.
Your output should have the general form (sample rows only shown):
Submission Requirement: The supplied SQL script task3.sql completed with your SQL commands to provide the required reports.
Appendix A
International programme for preservation of threatened species
As natural habitats disappear, it is increasingly difficult to ensure that all species can survive in the wild. One solution is to use zoos, reserves and other types of organizations that keep wild animals in captivity as conservation centres for threatened species.
To turn the keeping of animals into a preservation programme, it is necessary for centres to collaborate with each other and to coordinate their activities. This requires that they share records about animals, as well as carefully documenting exchanges and breeding. A database model has been prepared to assist this process. The following material provides background information describing the various components of the model.
Biological classification is a hierarchical structure, which moves from the highest (most general) level of domain down to species (the most specific level). The lowest three levels are family, genus and species.
Threatened Species
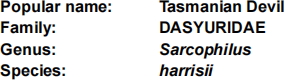
Organizations dealing with threatened species often need to check essential information about the animals. The most fundamental information is the name of the species, as well as its popular name and the genus and family to which the species belongs. The relevant details for the Tasmanian Devil, for instance, are as follows ...
It is also important to know the species’ natural range, which is usually given as a description of the geographic regions and natural habitats where a species is found in the wild.
The breeding and exchange programmes are chiefly concerned with animals whose existence in the wild is threatened, usually because they are rare or endangered in some way. This information is captured by a species’ conservation status. The chief international source for this information is the Redlist, which is maintained by the International Union for Conservation of Nature (IUCN).
The Redlist categorizes species using the codes listed in the table below.
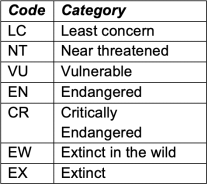
The Tasmanian Devil, for instance, is classified as Endangered, coded "EN". For a species the model needs to record this Redlist status. In addition to this Redlist status the URL for the full details for a species must also be recorded. For example, the full details for the Tasmanian Devil are recorded at http://www.iucnredlist.org/apps/redlist/details/40540/0.
Animals
For particular animals it is important to know which centre they are currently located at, their species name and the sex of the animal.
Centres
In most countries there is at least one zoo, reserve or other centre that hosts threatened species. There are several different types of centre where endangered animals are kept, including zoos, wildlife parks, sanctuaries and nature reserves. Centres need to contact each other, as do agencies, governments and the general public. Essential data includes the director’s name, as well as the phone number and address.
Conservation agencies
Conservation agencies in this context are bodies that coordinate, promote or manage conservation activities. Centres need to contact agencies on a regular basis, and need to have full contact details, including the director’s name, as well as their phone number and address. Two main types of agency need to be considered:
National agencies are based within a particular country and usually report directly to the government ministry responsible for conservation policy. They include authorities (e.g. Environment Australia) and usually manage various conservation programmes, as well as overseeing important conservation activities (e.g. national parks).
International agencies are bodies that are active in many countries. Formal association with particular countries is normally via a treaty, signed by the agency director and the relevant Minister in countries that are signatories to the agreement.
Funding sources
Conservation programmes depend on funds. Conservation agencies provide grants to centres.
There are several types of grants. One-off grants help centres build new facilities, purchase new equipment, cover the costs of exchanges, or to capture new animals from the wild. Annual grants help with the routine costs of running preservation programmes, such as salaries, and routine maintenance costs.
Exchange programmes
Animals are regularly exchanged between centres. Zoos, for example, often send offspring of successful breeding to other zoos or reserves. The practice allows other centres to raise public awareness by displaying the animals. It also reduces the risk of losing entire groups of animals should disease or other misfortune hit a centre. Most centres participate in exchanges at some time or other.
Exchanges occur by transfer of an animal from one centre to another. There are four main reasons for transfers: loans, medical treatment, breeding and permanent transfers. Sometimes animals are exchanged several times, e.g. for breeding purposes. Details of exchanges need to be recorded as part of an animal’s life history.
Breeding programmes
Some species of animals are now so rare in the wild that that their continued existence depends on cooperative breeding programmes involving zoos and wildlife reserves around the world. Centres need to keep careful track of breeding events. For each breeding event it is essential to know when and where (i.e. the centre) it took place, as well as the female and male involved. Any offspring that result are normally kept at the zoo where breeding takes place, but may later be transferred permanently elsewhere. The centre needs to be able to identify which breeding event produced which offspring. Animals captured from the wild will have no breeding event details available.
2021-07-12