MA424 Modelling in Operations Research
MA424 Modelling in Operations Research
Final project (part 2) 2020 - 2021
Foodys is a food delivery company that uses a fleet of scooters for delivering take away food from restaurants to customers’ homes. For safety, each scooter has to go through a checkup after it has worked for c consecutive days. Further, scooters are subject to breakdowns: the time a scooter is in service before breaking down follows an exponential distribution with rate µ per day. The company hires two mechanics, who are both qualified for checkups and repairs. However, mechanic 1 is specifically assigned for checkups and mechanic 2 for repairs. Scooters that need a checkup go to mechanic 1 and queue waiting for a checkup. Scooters that break down go to mechanic 2 and queue waiting for repair.
Suppose Foodys owns N scooters out of which n are working during Foodys working hours and the rest N − n are either at mechanic 1 for a checkup, mechanic 2 for repair, or in Foodys parking lot waiting to be used. When a scooter goes for a checkup or breaks down, it is replaced with one of the scooters in the parking lot. The first n working scooters are not subject to a checkup until they have had their first breakdown, but scooters in the parking lot are assigned a checkup time the minute they start working.
1 The first time Foodys is under-resourced
Foodys is concerned about having more than N − n scooters at the mechanics and thus having to work with less than n scooters. Suppose they start with n scooters working and N − n at the parking lot ready to be used when needed. Assume that the time mechanic 1 takes to do a checkup follows an exponential distribution with rate µ1 and mechanic 2 repair times also follow an exponential distribution with rate µ2. Let T be the first time that Foodys works with less than n scooters (i.e. they are under-resourced). We want to estimate E[T].
(i) Using N = 20, n = 10, c = 2, µ = 0.25, µ1 = 1.5, and µ2 = 2, build a simulation model to estimate E[T]. When you build your simulation model define your variables, events, event lists, output variables. Write down the pseudocode of each event case as we did in lecture. Implement your model by writing an R script to estimate E[T] using K = 500 iterations.
(ii) Find an estimate of E[T] where we are 95% confident that it is within 0.3 days of its true value. Give the sample standard deviation of your estimator. How many iterations did you have to run to get this value?
(iii) Give an interval centered around the estimate given in (ii) above where we are 90% confident that the true value of E[T] is within this interval. Show analytically that indeed this is a 90% interval.
(iv) Foodys wants to increase T by making the checkup/repair process more efficient. Without hiring extra mechanics, what advice can you give them? Explain why your advice would work better without performing any simulations to verify this.
2 Reduce the variance of the estimator
Foodys was happy with the estimator that you gave in part 1(i)-(ii) but they would like to improve its variance. Use control variates to reduce the variance of the estimator for E[t] used above. You might need to try different controlled estimators to see which one works the best (show results for all the estimators that you tried). For each controlled estimator, clearly state what you used as a control variate and justify your choice. Demonstrate the reduction in variance via simulation. Explain how you got the multiplicative constant for the control variate.
3 Correct the distribution of the mechanics
Foodys informs you that the distributions for the mechanics are not as given in part 1. For mechanic 1, the density function is  . For mechanic 2, the distribution function (CDF) is
  .
.
(i) For each mechanic, use a different method to simulate the service times. Justify why you used that method. Write two R functions, one for each mechanic, that simulate the service times.
(ii) Generate 10000 iid values from each function and plot their histogram with the densities of the distributions to show that they have indeed been simulated correctly (multiply the densities with a constant so that they align with the histogram and explain how you got that constant).
4 CEO’s visit to r cities
Foodys CEO needs to visit cities 1, 2, ..., r with city 0 being the city she is currently located at. Suppose a non-negative reward v(i, j) is associated with the CEO going from city i to city j. So if the CEO visits the cities in permutation x1, ..., xr then the reward of this choice x = (x1, ..., xr) is:
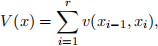
where x0 = 0. Note that there is no reward for coming back to city 0. To generate v(i, j), set seed to 1 and generate v(i, j) using Uniform(0, 1) random variables starting from i = 0 and j = 1, ..., 10, then v(1, j) for j = 2, ..., 10, v(2, j) for j = 1, 3, 4, ..., 10 and so on.
(i) Use MCMC and r = 10 to simulate high reward itineraries for the CEO. Define the stationary distribution that we want our Markov Chain to converge in such a way that high valued solutions are given extremely high probability and include a tunable parameter. Find 3 values of this parameter where the generated Markov Chain behaves differently in the long run for each of these 3 values and demonstrate this using plots and averages.
(ii) If you could change this parameter during one simulation of the stationary distribution, how would you change it in order to improve the solutions. Demonstrate that you can get better solutions than the fixed 3 values that you used in (i) by running it in R. Present all your results.
Deliverables and report content - final project part 2
You are expected to write a report helping Foodys with all their questions above. The report should be accompanied with the corresponding R scripts. The report should be divided into parts where each part corresponds to a question posed above. For each question part (for example Question 1(ii) or Question 3), the solution should comprise of two parts:
● The technical part: this part can be technical and you can assume that the reader is familiar with simulation and R. This part should include an explanation of the analysis, a brief explanation of what each relevant R scripts does, an explanation of the solution.
● The comments to the CEO: this part should not be technical and should present to the CEO a brief summary of the analysis and the derived results. Understanding this part should not require the knowledge of simulation or R. This part need not be very long. A paragraph would be enough.
You should separate each of the above parts with a title so that it is clear to the reader which part is the technical part and which part is for the CEO.
Some further rules and pointers:
1. For generating random variables, you are only allowed to use the function runif(n) for n a positive integer. If you use any other function to generate random variables you will be penalised.
2. Start every R script with the command set.seed(1). In Exercise 4, generate v(i, j) as instructed right after the set.seed(1) command and make sure you generate it in the same order as the question indicates so that we get the same values.
3. You may use R code from some of the R scripts that I provided for the lectures or the exercises. If you do that, you need to write this clearly in your report otherwise this will be considered plagiarism.
4. Each R script should have detailed comments and explanations so that someone who does not understand R can figure out what the code does at each step.
5. The technical part of the report should explain what each corresponding R script does so that someone that has not seen the R code can read the report and understand what you have done.
6. Use a separate R script for each question part. If in one question you are using the same R script from a previous question but with some modifications, then make another copy of the R script and name it with the corresponding question number.
7. Do not use an executive summary or appendices.
8. Include all necessary graphs in the report. Make sure the graphs is at the correct position in the report.
9. The report should be typed and in pdf format.
10. Do not copy the R code in the report. Submit the R files along with the report.
Guidelines - final project part 2
(a) The deadline for submitting this project is 26/01/2021 midnight UK time. The pdf file of the report, and the R scripts should be contained in one .zip file, to be uploaded on the moodle MA424 page anonymously - only with your exam candidate number - by the deadline. Name your zip. file with your exam candidate number only. There will be separate submission links for part 1 and part 2 of the project. Please take care to submit the correct part under the correct link.
(b) You are expected to work in the group of size at most three assigned to you by the course leaders.
(c) All components of the report must be written by each student individually. You may not seek advice from anyone else other than your fellow group members and the MA424 lecturers.
(d) The R code should also be written by each student individually.
(e) On a separate page at the beginning of your report, you must provide candidate exam number of all other students who you worked together with, and a brief statement on the extent of collaboration and the individual contributions. (e.g., “we prepared the simulation model together, and both of us had about the same contribution”, “we prepared the simulation model together, but I had the most input”, “we worked mostly separately, but she explained to me how to generate the normal distribution”). Common elements of work that are not declared will be considered as cases of plagiarism.
(f) The report should not exceed 8 pages but should ideally be 6 pages (excluding the page described on point (e)) with 11pts, single spacing. Note that in part 2 of the project you are not allowed to have appendices.
(g) Any part of the project submitted without all associated R files will be given a mark of zero. If an answer is given in the report that cannot be confirmed by your code, then this will be considered as plagiarism.
(h) You are allowed to ask only clarification questions to the MA424 lecturers.
(i) The clarification questions should be asked on the Moodle forum so that the answers are visible to all MA424 students.
Marking scheme - final project part 2
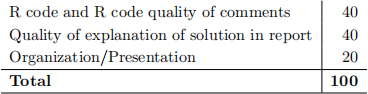
- R code and R code quality of comments. The correctness of the code, the use of appropriate R functions as described above, the quality of the comments that make it easy for someone who does not know R to understand what your code does.
- Quality of explanation of solution in report. The correctness of the solution and analysis, the quality of the explanation of the R scripts, the quality of the explanations of the solution, and the quality of the comments to the CEO.
- Organisation/Presentation. A report should be clear, concise, well organised, well formatted and well presented with appropriate use of figures and tables, and well commented. It should also follow the instructions in terms of type of files, length, font size, and spacing.
2021-07-06