COMP 1012 Summer 2021 Assignment 2
COMP 1012 Summer 2021 Assignment 2
Due Friday July 9, 2021, at 11:59 PM
Material Covered
- Weeks 1-7
Description
You are stepping back into your data analyst shoes, but this time you have more tools at your disposal to help the analysis go smoothly. Unfortunately, your superiors have recognized your increased talents and have increased the demand on you accordingly. Another season has just ended, and they want even more data than before.
Part 0: Standards
Be sure to follow all programming standards in the document provided on the course website, including comments where appropriate and at the beginning of all files submitted. Remember to include all your imports at the top of the file.
You should never use break or continue and any function you write should have at most one return statement.
Save your python file as LastNameFirstNameA2.py (e.g., SmithJohnA2.py). Output files should be named the same way, but with Output on the end (e.g., SmithJohnA2Output.txt). Marks will be deducted for incorrectly named files.
This assignment will have you creating many functions. You may create more functions than are listed here if you find adding additional methods helpful. If you do, be sure that they are commented well, including doc strings.
Part 1: Cleanup
The first item on your list is to revisit your old code and make it more efficient. In particular, you are going to make it all into functions instead of one big program. You have been provided an A2Starter.py file which contains a working solution to Assignment 1 to build off. If you would prefer to use your own solution to Assignment 1 (perhaps you read ahead and everything is already in functions), then you may.
Refactor your code into the following functions. You should not write any of these (except main) from scratch; you should be editing and wrapping your existing code in functions. This part may seem long, but it involves little work.
NOTE: Only main should call other functions in your code. Your functions should not otherwise call each other unless the instructions below specifically tell you to.
1. main
a. This function should go LAST in your code and accept a single parameter: the string name of a file you want to analyze, such as “SampleInput.csv”.
b. Main does not do any processing itself, but it oversees calling all the other functions and handling their input and output.
c. It is a good idea to build a skeleton of main as your first function and then gradually fill it in as you add more functions.
2. readData
a. This function encompasses Part 1 of A1, in which you read a file and process it into a list of games.
b. The function should accept one parameter: the filename.
c. The function should return the list of games, called allGames in A1.
3. createDirectory
a. This function encompasses Part 2 of A1, in which you created the empty dictionary directory and populated it with the names of teams.
b. The function should accept one parameter: the list of games.c. The function should return the directory.
4. aggregateGames
a. This function encompasses Part 3 of A1, in which you populated the dictionary with the game data.
b. The function should accept two parameters: the list of games and the directory.
c. The function should not return anything. (Food for thought: why not?)
5. printStandings
a. This function encompasses Part 4 of A1, in which you printed the standings table.
b. The function should accept one parameter: the directory.
c. The function should not return anything.
d. Note: This should print them in sorted order by points; if you are using your own solution file, make sure you have done this (or that you take that line from the provided solution)
6. summaryQuestions
a. This function encompasses Part 5 of A1, in which you answered summary questions and printed results.
b. The function should accept one parameter: the directory.
c. The function should not return anything.
d. Note: the solution provided determines the league winner the hard way, but since you have access to a sorted directory (see printStandings), you can get it more efficiently. Change the code to do that.
7. deeperAnalysis
a. This function encompasses Part 6 of A1, in which you answered tougher questions and printed results.
b. The function should accept two parameters: the list of games and the directory.
c. The function should not return anything.
d. Note: This function no longer has free access to the league winner, but it is trivial to get it again with the same method as you did in summaryQuestions.
Be sure to give each function a brief doc string which explains its purpose. Check the Week 6 material on doc strings.
Test your code by running it on the old SampleInput.csv file and making sure you still get the right output. Remember that your last line of the file should be a call to main, passing it the filename, outside of any function. That should be the only line of code (apart from any import statements) that is not inside some function or other.
Part 2: A Better Way
Now that we have everything in functions, we’re going to clean things up a bit more. In A1, we used a list to store the data for each team, but this was not the best idea. Using a list required us to remember which position was Regulation Wins and which was Overtime Losses and that can get confusing.
- Edit the createDirectory function so that instead of using a list containing six zeroes, when a team is added to the directory, its value is a dictionary (keys are the standings headers and values are zero, as below)
{"GP":0,"W":0,"OTW":0,"L":0,"OTL":0,"PTS":0,"GF":0,"GA":0}
- Edit the aggregateGames function to correctly populate the directory now that its values have changed.
o Instead of calculating GP and PTS at the end of this function, update them as you go through the list of games, the same as all other pieces.
- Edit printStandings, summaryQuestions, and deeperAnalysis to use the dictionary method.
We're also going to make one more change at this stage. Write a one-line function sortDirectory that takes two parameters (a dictionary of team data and a key) and return the result of sorting the directory by the key column. Edit printStandings, summaryQuestions, and deeperAnalysis to call this new method (by passing it directory and "PTS" as the key) instead of doing the sorting themselves.
Part 3: Print Control
One of the things your bosses have told you is that they want to be able to analyze several seasons at once. You can immediately foresee a problem here: that would print a huge amount of data to the console, and it would be impossible to keep track of. You could just not call the analysis functions, but you want to have the data available if you need it. The solution is then to change where the printing actually happens.
Edit the printStandings, summaryQuestions, and deeperAnalysis functions so that they do not print anything, but instead create a giant string of what would be their printed output and return it instead.
Hint: You may find it useful to write a one-line helper function here, buildString, that takes in two strings as input and returns them combined with a newline character in the middle.
Edit your main function to do the printing. This should be one line per function; a print statement surrounding the name of the variable in which the output is stored, like the example shown here:
standings = printStandings(directory)
print(standings)
Make sure to run your code when you're done; the output should look identical to how it did before.
Part 4: Multiple Seasons
It is almost time to do some new work. Your main function is good and simple if it is doing one season, but you now know that you will be asked to analyze multiple seasons at once.
Change the name of your main function to processSeason and define a new main function after it. The new main should take in two parameters: a list of strings containing filenames, and a string with the name of an output file. It should use a for loop to call processSeason on each filename in its list. Make sure to edit your external call to main (the last line of your Python file) accordingly.
This is also a good time to handle that printing issue you foresaw. Edit processSeason so that it builds a big string out of the output it received from printStandings, summaryQuestions, and deeperAnalysis and then returns that instead of doing any printing itself.
Edit your main function to print the data it got from processSeason if it only processed one season, and otherwise to write all output (from all calls to processSeason) to the provided output file.
Test your code by passing it the following:
main(["gameData.csv","SampleInput.csv"],"multiSeasonOutput.txt")
Part 5: Season Generation
Part 5.1 - generate
You have all this code sitting here, but your bosses haven't sent you more season files. Since all of them are apparently on vacation, you decide it's time to simulate your own season data to analyze.
Download the teamNames.txt file from the assignment folder. This is a list of potential team names, one per line. Feel free to add more to it if you are a sports fan and your favourite team has not been included.
Define a new function: generate, which will create a CSV file like the ones you've been analyzing.
- generate should accept three parameters:
o An integer, teams, denoting the desired number of teams in the league.
o An integer, gamesPerTeam, denoting the desired number of games each team should play.
o A filename, output, to write the results to.
- All of generate's parameters should be given default values.
o teams should default to 10.
o gamesPerTeam should default to 50.
o output should default to "generatedSeason.csv"
- generate should not return anything.
The core of generate should do the following:
- First, open and read in the list of potential team names from teamNames.txt.
- Randomly choose teams team names from that list. Don't forget to close the file!
- Next, figure out the total number of games that will be played this season. This can be calculated from teams and gamesPerTeam.
o Hint: Each game is between exactly two teams.
- Next, use a loop to generate each game one at a time. You can mostly do this any way you want, but you must fulfill the following conditions:
o Each game should have a unique game number, starting at 1 and counting up to the number of games.
o Each team's score in each game should be a random integer between 0 and 9, inclusive.
o If both teams got the same score, then the game went to overtime.
▪ Increase one of the team's scores, chosen at random, by 1.
o If you decided to be clever and write your code such that ties were already impossible, then you should make it so that 50% (chosen randomly) of 1-goal games went to overtime.
- Once all the games have been generated, they should be printed to the CSV file provided in output, one per line, as seen in SampleInput.csv and gameData.csv.
Note that you cannot simply pick a random pair of teams for each game, because you may not end up with each team having played exactly the right number of games. There are many ways around this problem, but one of the simplest is to keep track (using a dictionary) of how many games you have generated for each team, and then only randomly choosing out of those who have played the fewest games so far.
For example, if partway through your season, the counts look like this:
{"Ducks":5,"Sharks":7,"Oilers":8,"Jets":5,"Flames":5,"Rangers":6}
Then the next game of the season should be between two of the Flames, Jets, and Ducks, as they have played the fewest number of games.
Part 5.2 – calling generate
Create a new function massGenerate that takes one integer parameter, a number of seasons to generate. It should use a for loop to call generate the appropriate number of times. Before entering the loop, it should randomly determine the number of teams it wants (between 5 and 30, inclusive) and randomly determine the number of games each team should play (between 50 and 99, inclusive). The files should be named "generated1.csv", "generated2.csv", and so on.
Call massGenerate just above where you call main; you can comment one out when you are testing the other.
BONUS: Edit massGenerate so that it accepts two additional optional parameters: a number of teams and a number of games per team. If these values are given, then it should pass them to generate instead of randomly determining values.
Part 6: Tiebreaking
Since you still haven't heard from your bosses about what they want next, you decide it is time to handle ties in the standings, which up until now you'd just been hoping would never happen.
Write a new function, tiebreaker, which accepts the directory (created in createDirectory and populated in aggregateGames) as a parameter. Tiebreaker should go through the dictionary and break ties. Remember, these are for teams tied on PTS.
The tiebreaking procedures are, in order:
- Most regulation wins.
- Most regulation + overtime wins.
- Highest goal differential (goals for – goals against).
If teams are somehow still tied after all three of those, placement should be determined randomly.
For each tie in the standings (not just for first place), tiebreaker should check the tiebreaking conditions until it finds a way to determine a winner and modify the dictionary somehow. It does not return anything. Insert a call to tiebreaker into your processSeason function just before the call to printStandings.
There are many ways to implement this function. You can choose any one you want, so long as, after it is finished, the standings table prints in the correct order. My solution file does this by adding a new key to the dictionary of each team, which I called "Rank", where the values were computed based on the team's data and the tiebreaking methods. I also edited some of my other functions so that they sorted on Rank instead of on PTS. The example below shows Rank in use. If you can figure out how I calculated it, you can do the same thing, but you can use any method you like if it works.
Example: Here is a potential directory before being sent to tiebreaker.
{'Blackhawks': {'GP': 20, 'W': 7, 'OTW': 2, 'L': 10, 'OTL': 1, 'PTS': 26, 'GF': 50, 'GA': 59}, 'Coyotes': {'GP': 20, 'W': 8, 'OTW': 2, 'L': 7, 'OTL': 3, 'PTS': 31, 'GF': 65, 'GA': 74}, 'Reds': {'GP': 20, 'W': 9, 'OTW': 1, 'L': 8, 'OTL': 2, 'PTS': 31, 'GF': 64, 'GA': 61}, 'Sabres': {'GP': 20, 'W': 9, 'OTW': 2, 'L': 5, 'OTL': 4, 'PTS': 35, 'GF': 68, 'GA': 52}, 'Giants': {'GP': 20, 'W': 6, 'OTW': 4, 'L': 9, 'OTL': 1, 'PTS': 27, 'GF': 68, 'GA': 69}}
And here is that directory after tiebreaker is finished.
{'Blackhawks': {'GP': 20, 'W': 7, 'OTW': 2, 'L': 10, 'OTL': 1, 'PTS': 26, 'GF': 50, 'GA': 59, 'Rank': 2600700899103}, 'Coyotes': {'GP': 20, 'W': 8, 'OTW': 2, 'L': 7, 'OTL': 3, 'PTS': 31, 'GF': 65, 'GA': 74, 'Rank': 3100800999101}, 'Reds': {'GP': 20, 'W': 9, 'OTW': 1, 'L': 8, 'OTL': 2, 'PTS': 31, 'GF': 64, 'GA': 61, 'Rank': 3100901000304}, 'Sabres': {'GP': 20, 'W': 9, 'OTW': 2, 'L': 5, 'OTL': 4, 'PTS': 35, 'GF': 68, 'GA': 52, 'Rank': 3500901101600}, 'Giants': {'GP': 20, 'W': 6, 'OTW': 4, 'L': 9, 'OTL': 1, 'PTS': 27, 'GF': 68, 'GA': 69, 'Rank': 2700600999902}}
Here is the standings table for that league:
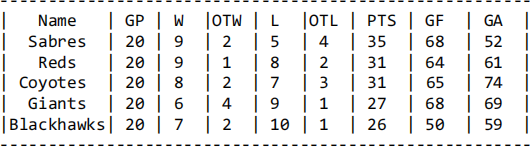
As you can see, the Reds and Coyotes were tied for second, but the Reds had more regulation wins (W), so took the higher spot.
Note: You may need to edit other methods to preserve consistency. For example, if you did what I did and added a new value, you will want to make sure that your functions which get a sorted dictionary now sort on that new value. Or, if you instead modified the PTS column, you must make sure that only the original values of PTS get printed. The user should not be able to tell the difference between the outputs in the standings apart from the order.
Part 7: BONUS
THIS SECTION IS FOR BONUS MARKS AND THUS OPTIONAL.
Part 7.1 – More Ties
Edit your summaryQuestions and deeperAnalysis functions so that they can handle ties too. Instead of tiebreaking, though, they should simply include all tied candidates in their output. Note that the team that wins the league should not have ties because tiebreaker should have taken care of that.
Example:
The Sabres won the league with 84 points
The Sabres had the highest winning percentage: 56.0%
The Flames, Sabres had the best goal differential: +24
The Capitals received the highest percentage of their points from overtime: 21.1%
The team with the best record against the Sabres was the Flyers: 4-0-1-0
The team with the longest winning streak was the Marlins, Capitals (9 games)
The team with the longest point streak was the Capitals (9 games)
Part 7.2 – Reusing Code
You may have noticed that the deeperAnalysis function basically repeats what happens in aggregateGames twice, once in order to get the best record against the league champion and once for the streaks. Modify this code so that it instead calls aggregateGames to do that work for it, and then just edits the results. Note that you will have to create new dictionaries to pass to aggregateGames; passing it directory won't help.
Part 8: Handin
Hand in the following:
- Your python script (e.g., SmithJohnA2.py)
- One generated season (from Part 5); generated1.csv
- Your output file after running the following line of code:
main(["SampleInput.csv","gameData.csv","gameDataA2.csv","generated1.csv"], "LastFirstA2Output.txt")
Where LastFirst is replaced by your last and first names.
2021-07-02