STA 13Y- Final Exam Review
Hello, dear friend, you can consult us at any time if you have any questions, add WeChat: daixieit
STA 13Y- Final Exam Review
SHORT ANSWER. Write your answer on a separate sheet of paper.
Provide an appropriate response.
1) Define the terms population, sample, parameter and statistic.
2) Distinguish between categorical and quantitative data. Give an example for each.
3) Define continuous and discrete data and give an example of each.
4) Histograms and Bar graphs are both bar charts. What is the significant difference between the two?
5) We want to compare two different groups of students, students taking Composition 1 in a traditional lecture format and students taking Composition 1 in a distance learning format. We know that the mean score on the research paper is 85 for both groups. What additional information would be provided by knowing the standard deviation?
6) Marla scored 85% on her last unit exam in her statistics class. When Marla took the SAT exam, she scored at the
85 percentile in mathematics. Explain the difference in these two scores.
SHORT ANSWER. Write the word or phrase that best completes each statement or answers the question.
7) Describe any similarities or differences in the two distributions represented by the following boxplots. Assume the two boxplots have the same scale.


Find the mean and median for each of the two samples, then compare the two sets of results.
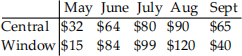
8) A comparison is made between summer electric bills of those who have central air and those who have window units.
MULTIPLE CHOICE. Choose the one alternative that best completes the statement or answers the question.
Determine which of the four levels of measurement (nominal, ordinal, interval, ratio) is most appropriate.
9) Salaries of college professors.
A) Nominal B) Ratio C) Ordinal D) Interval
10) The subjects in which college students major.
A) Nominal B) Ratio C) Ordinal D) Interval
Identify which of these types of sampling is used: random, stratified, systematic, cluster, convenience.
11) An education researcher randomly selects 48 middle schools and interviews all the teachers at each
school.
A) Random
B) Convenience
C) Cluster
D) Systematic
E) Stratified
Use the data to create a stemplot.
12) The following data show the number of laps run by each participant in a marathon.
46 65 55 43 51 48 57 30 43 49 32 56
A) B)
3 0 2 3 0 2
4 3 3 6 8 9 4 3 6 8 9
5 1 5 6 7 4 1 3 5 6 7
6 5 6 5
Provide an appropriate response.
13) The histogram below represents the number of television sets per household for a sample of U.S.
households. How many households are included in the histogram
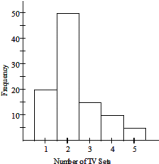
A) 100 B) 110 C) 95 D) 90
Determine which score corresponds to the higher relative position.
14) Which is better, a score of 92 on a test with a mean of 71 and a standard deviation of 15, or a score
of 688 on a test with a mean of 493 and a standard deviation of 150?
A) A score of 92
B) Both scores have the same relative position.
C) A score of 688
Find the indicated probability.
15) A die with 8 sides is rolled. What is the probability of rolling a number less than 7?
A) 6 B) ![]() C)
C) ![]() D)
D) ![]()
Find the indicated complement.
16) The probability that Luis will pass his statistics test is 0.58. Find the probability that he will fail his statistics test.
A) 1.38 B) 0.42 C) 0.29 D) 1.72
Find the indicated probability.
17) The table below describes the smoking habits of a group of asthma sufferers.
Occasional Regular Heavy
Nonsmoker smoker smoker smoker Total
Men 376 31 64 41 512
Women 341 46 74 37 498
Total 717 77 138 78 1010
![]() If one of the 1010 people is randomly selected, find the probability that the person is a man or a
If one of the 1010 people is randomly selected, find the probability that the person is a man or a
heavy smoker.
A) 0.584 B) 0.544 C) 0.526 D) 0.503
Find the indicated probability. Express your answer as a simplified fraction unless otherwise noted.
18) The following table contains data from a study of two airlines which fly to Small Town, USA.
Number of flights Number of flights
which were on time which were late
Podunk Airlines 33 6
Upstate Airlines 43 5
If one of the 87 flights is randomly selected, find the probability that the flight selected arrived on time given that it was an Upstate Airlines flight.
A) ![]() B)
B) ![]()
![]()
![]() 11 D) None of the above is correct.
11 D) None of the above is correct.
Find the indicated probability. Round to the nearest thousandth.
19) A study conducted at a certain college shows that 56% of the school's graduates find a job in their chosen field within a year after graduation. Find the probability that among 6 randomly selected graduates, at least one finds a job in his or her chosen field within a year of graduating.
A) 0.560 B) 0.167 C) 0.993 D) 0.969
Solve the problem.
20) A study revealed that 45% of college freshmen are male and that 18% of male freshmen earned college credits while still in high school. Find the probability that a randomly chosen college freshman will be male and have earned college credits while still in high school.
A) 0.400 B) 0.081 C) 0.530 D) 0.027
Use Bayes' theorem to find the indicated probability.
21) 3.6% of a population are infected with a certain disease. There is a test for the disease, however the test is not completely accurate. 95.3% of those who have the disease test positive. However 4.2% of those who do not have the disease also test positive (false positives). A person is randomly selected and tested for the disease. What is the probability that the person has the disease given that the test result is positive?
A) 0.541 B) 0.459 C) 0.847 D) 0.036
Provide an appropriate response.
22) In a game, you have a 1/36 probability of winning $81 and a 35/36 probability of losing $3 . What is your expected value?
A) -$2.92 B) $2.25 C) $5.17 D) -$0.67
Solve the problem.
A small private college decided to randomly and independently sample 15 of their students and ask if they have a tattoo. Find the probability that exactly 5 of the students reported that they did
have at least one tattoo.
A) 0.218 B) 0.207 C) 0.515 D) 0.722
Find the indicated probability.
24) The weekly salaries of teachers in one state are normally distributed with a mean of $490 and a standard deviation of $45. What is the probability that a randomly selected teacher earns more than $525 a week?
A) 0.2823 B) 0.2177 C) 0.7823 D) 0.1003
Solve the problem. Round to the nearest tenth unless indicated otherwise.
25) Human body temperatures are normally distributed with a mean of 98.20°F and a standard deviation of 0.62°F. Find the temperature that separates the top 7% from the bottom 93%. Round to the nearest hundredth of a degree.
A) 98.40°F B) 97.28°F C) 98.78°F D) 99.12°F
Solve the problem.
26) A random sample of 250 students at a university finds that these students take a mean of 15.2 credit hours per quarter with a standard deviation of 2.3 credit hours. Estimate the mean credit hours taken by a student each quarter using a 95% confidence interval. Round to the nearest thousandth.
A) 15.2 ± .285 B) 15.2 ± .188 C) 15.2 ± .012 D) 15.2 ± .018
27) A previous random sample of 4000 U.S. citizens yielded 2250 who are in favor of gun control legislation. How many citizens would need to be sampled for a 90% confidence interval to estimate the true proportion within 1%?
A) 6766 B) 6224 C) 7036 D) 6660
SHORT ANSWER. Write your answer on a separate sheet of paper.
Assume that a hypothesis test of the given claim will be conducted. Identify the type I or type II error for the test.
28) A medical researcher claims that 12% of children suffer from a certain disorder. Identify the type I error for the test.
Assume that a simple random sample has been selected from a normally distributed population and test the given claim. Identify the null and alternative hypotheses, test statistic, critical value, and state the final conclusion that addresses the original claim.
29) A large software company gives job applicants a test of programming ability and the mean for that test has been 160 in the past. Twenty-five job applicants are randomly selected from one large university and they produce a mean score and standard deviation of 183 and 12, respectively. Use a 0.05 level of significance to test the claim that this sample comes from a population with a mean score greater than 160.
Test the indicated claim about the means of two populations. Assume that the two samples are independent simple random samples selected from normally distributed populations.
30) A researcher was interested in comparing the resting pulse rates of people who exercise regularly and of those who do not exercise regularly. Independent simple random samples of 16 people who do not exercise regularly and 12 people who exercise regularly were selected, and the resting pulse rates (in beats per minute) were recorded. The summary statistics are as follows.
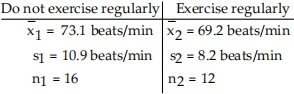
Use a 0.025 significance level to test the claim that the mean resting pulse rate of people who do not exercise regularly is larger than the mean resting pulse rate of people who exercise regularly.
2023-03-27