AD654: Marketing Analytics Assignment III
Hello, dear friend, you can consult us at any time if you have any questions, add WeChat: daixieit
AD654: Marketing Analytics
Assignment III: Classification: Will this Customer Purchase the Package?
For this assignment, you will use the file telco_churn.csv, which can be found on our course Blackboard
page.
For Parts I and II of this assignment, you will upload two files into Blackboard: The .ipynb file that you create in Jupyter Notebook, and an .html file that was generated from your .ipynb file. If you run into any trouble with submitting the .html file to Blackboard, you can submit it as a PDF instead.
For any question that asks you to perform some particular task, you just need to show your input and output in Jupyter Notebook. Tasks will always be written in regular, non-italicized font.
For any question that asks you to include interpretation, write your answer in a Markdown cell in Jupyter Notebook. Anyhomeworkquestion that needs interpretation wilbe written in italicized font. Do not simply write your answer in a code cell as a comment, but use a Markdown cell instead.
Remember to be resourceful! There are many helpful resources available to you, including the video library, the lecture notes on Blackboard, the Zoom office hours sessions, and the web.
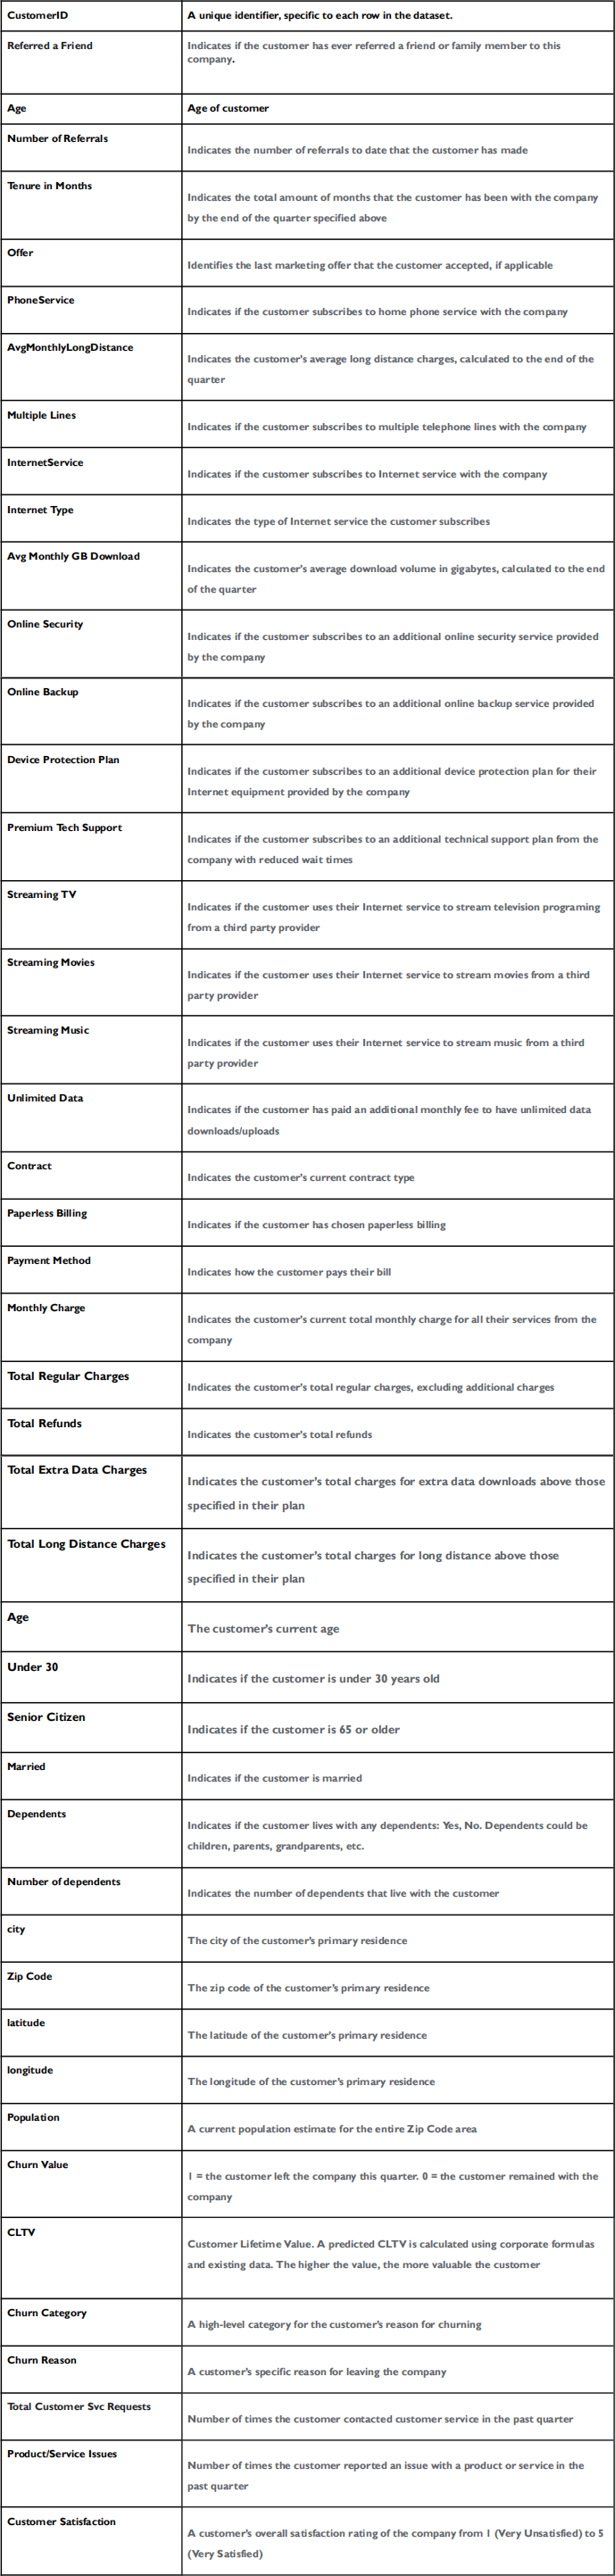
For this assignment, we will use the telco.csv dataset, which contains information about telephone company subscribers.
A dataset description is listed below:
Part I: Logistic Regression Model:
A. Bring the dataset telco_churn.csv into your environment, and use the head() function to explore the variables.
B. Whichofthevariables here arecategorical? Which are numerical?
C. Use the value_counts() function from pandas to learn more about the outcome variable,‘Churn Value’. Describe yourfindings-- whatarethedifferentoutcome classes here, and how common areeachoftheminthedataset?
D. Location-related (geographic) variables. Which variables in this dataset are location-related? Remove them from the dataset.
E. Remove the ‘Internet Type’and ‘Customer ID’variables from your dataset.
a. Why woulda categoricalvariablewithentirely uniquevalues (suchas Customer ID) notbe usefulas a predictorina supervisedmachine learning model?
F. Why willchurncategory andchurn reason not besuitable inputvariables in a modelthatpredictswhethersomeonewillchurn?
a. Remove them from the dataset.
G. Missing values. Are there any variables in this dataset for which more than half the values are missing? If so, remove them.
a. Why mightitbedangeroustoimputevaluesforvariableswitha huge% ofmissingness?
H. Examining correlations
a. Build a correlation table to examine the correlations among your numeric independent variables.
i. Arethere any correlations herethatare so highastopresenta likely problemwithmulticollinearity? If so, remove one member of any highly-correlated pair. If not, keep rolling on.
I. For yourcategorical inputvariables,whichones requirefurtherhandlinginorder to be dummified for use in a model? Which ones are okay in their current format?
a. For any variables that need further treatment, dummify them, being sure to drop one level as you do.
J. Create a data partition. For your random_state value, use a number based on either your work, home, or school address, or just a number that you like (For example, I live at 200 Market St, I work at 1010 Commonwealth Avenue, and my lucky number is 80, so I could use either 200, 1010, or 80). Assign 40% of your rows to your test set, and 60% to your training set.
a. Howdidyoupickyourseedvalue?
K. Compare the mean values of the variables in the dataset after grouping by Churn Value.
a. Fromtheresultsyou seehere, chooseany THREEindependentvariables fromthedataset,andspeculateabouttheir likely impactontheresult– doyouthinkthisvariablewillbestrongly impactful? Why or why not?
(This is not a formal statistical test - the goal here is to look at your results and start to speculate about variables that might be impactful).
Iteration #1
L. Build a logistic regression model using statsmodels, with the outcome variable ‘Churn Value’. Use the rest of the remaining variables from the dataset as inputs Remember to use only your training data to build this model.
M. Show the summary of your model with log_reg.summary(). (Note: If you named your model something else, e.g. mymodel, you can just use mymodel.summary() here).
a. Whichofyour numericvariables here areshowing highp-values?
b. For your categorical variables, whichones are showing highp-values for ALLoftheir levels?
Iteration #2
N. Now, build yet another model. Again use statsmodels, and again, use your training set only. Start with the variables you used in Iteration #1 but drop the ones you identified in the previous step, for parts (a) and (b).
a. Show the results of this 2nd model with log_reg.summary().
O. Using scikit-learn, build another version of Model Iteration #3. You will use this version of the model for all remaining steps.
P. Assess the performance of your model against the test set. Build a confusion matrix, and answer the following questions about your model. You can use Python functions to answer any of these questions or you can use your confusion matrix to determine the answers in a slightly more manual way. The ‘positive’ class in this model is represented by the “1” outcome.
a. Whatisyourmodel’s accuracyrate?
b. Whatisyourmodel’ssensitivity rate?
c. Whatisyourmodel’sspecificity rate?
d. Whatisyourmodel’s precision?
e. Whatisyourmodel’sbalancedaccuracy?
Q. Compare your model’s accuracy against the training set vs. accuracy against the test set (just use accuracy only for this).
a. Whatisthepurpose ofcomparingthosetwovalues?
b. Inthis case, what does thecomparisonofthosevaluessuggestaboutthe modelthatyouhavebuilt?
R. Make up a customer. Assign this customer a value for each predictor variable in this model, and store the results in a new dataframe. Now, put your customer through this model.
a. Whatdidyourmodelpredict-- willthiscustomertakethereturnoffer?
b. According toyour model, what is theprobability that the customer will churn?
S. When using a logistic regression model to make predictions,why isitimportant toonly usevalueswithintherange ofthedataset usedtobuildthemodel?
a. Make a new dataframe, but this time, for the numeric predictor variables, select some numbers that are outside the range of the dataset -- do not use a 400+ year-old vampire named “Mary.” Use your model to make a prediction for this new dataframe. Whatdoyounoticeaboutthe result? (To answer this, don’t simply state the predicted outcome, but also write 1-2 sentences of explanation for what you see).
Part II: Random Forest Model
T. Read the dataset back into Python.
U. For the variable deletion, just delete any variables that you deleted in the previous section.
W. Re-partition the data, using the same seed value that you used in the previous part of this assignment.
X. Build a random forest model in Python with your training set. Use the same input variables, and same output variable, as you used in the first logistic regression model (the only difference here is that the categories should not have any levels dropped).
Use GridSearchCV to help you determine the best hyperparameter settings for your model.
Y. How didyour random forest model rank the variables in order of importance, from highest to lowest? For a random forest model, how can you interpret feature importance?
Z. Assess the performance of your model against the test set. Build a confusion matrix to do this. You can use Python functions to answer any of these questions or you can use your confusion matrix to determine the answers in a slightly more manual way. The ‘positive’class in this model is represented by the “1” outcome.
a. Whatis your model’s accuracy rate?
b. Whatis your model’s sensitivity rate?
c. Whatis your model’s specificity rate?
d. Whatis your model’s precision?
e. Whatis your model’sbalancedaccuracy?
AA. Compare your model’s accuracy against the training set vs. your model’s accuracy against the test set. Howdiferentwerethese results?
BB. Use the predict() function with your model to classify the person who you invented in the previous section. Doesthe modelthinkthis householdwilacceptthe return ofer?
(Note: This question says to“classify the person.”It does not say that the dataframe will be set up in the exact same way).
CC. For this question, no Python code is required -- just use a Markdown cell to answer.
Write a 3-5 sentence paragraph that speculates about how the telephone company mightcare about being able to use this model. There is not a single“correct”answer to this question. Be thoughtful and be creative, and consider the impact of being able to predict whether a specific household will accept a particular offer and/or how likely they are to accept it. You can mention a marketing angle, an operations angle, or anything else that comes to mind.
Part III: Wildcard ( 1 point)
For this section, we’ll try something a bit different. We are going to try something that is inspired by a project that an ABA student built during his CPT internship over the summer for a bubble tea company.
First, find the Yelp review page for a restaurant, coffee shop, or other establishment. It can actually be any place with a Yelp review page (but preferably, make it a place that you have been to before, and are familiar with).
Using any web-based wordcloud tool, generate a wordcloud of these Yelp reviews. To do this, you might have to be a little bit creative. You can extract the reviews any way that you wish to, but one way that will certainly work is to copy & paste them into a document that you later import into the wordcloud tool. The exact number of reviews that you use is up to you, but it should be enough to enable you to generate a meaningful wordcloud.
Include a screenshot of your wordcloud, along with a thoughtful paragraph describing what it shows about the business, the reviews, and/or the reviewers.
This section should not be stressful. The purpose is to show how useful/valuable a simple web-based tool can be for enabling you to generate some result with marketing analytics value. You are highly encouraged to play around with the features on whatever wordcloud site you use -- check out some of the options for fonts, colors, shapes, designs, etc. Have some fun with it! As long as your wordcloud consists of content from the Yelp reviews, and you have included a thoughtful paragraph describing what it shows, you will receive the point.
If you choose to approach this question another way, that’s okay – but if you do not generate a wordcloud, you will receive 0 points for this.
2023-03-25
Classification: Will this Customer Purchase the Package?