PS113 Statistical Methods in Psychology - Assessment 2
Hello, dear friend, you can consult us at any time if you have any questions, add WeChat: daixieit
PS113 Statistical Methods in Psychology - Assessment 2
Please note that the maximum number of marks you can obtain for each question part is written next to the question. The number reflects the importance of the question, and not necessarily the length of the answer you need to give. For this assessment you will receive a score out of 80, plus:
Up to 5 additional marks are available and awarded based on presentation, completeness of answers, and clarity/presentation of worked solutions.
Up to 15 additional marks are available for answers which go beyond the lec- ture materials, presenting relevant additional analyses and discussion, which demonstrate an enhanced understanding, and application, of statistical meth- ods.
Statistical Tables can be found in the Howell book and on the PS113 Moodle page.
Question 1) a) Each figure below represents hypothetical data from six different stud- ies that used factorial designs with two main variables, A and B. Assuming that the amount of variability within each cell of the analysis is both very small and equal across all conditions, state for each figure whether the main effect of A, the main effect of B, and the A x B interaction were likely to have been significant. (12 points)
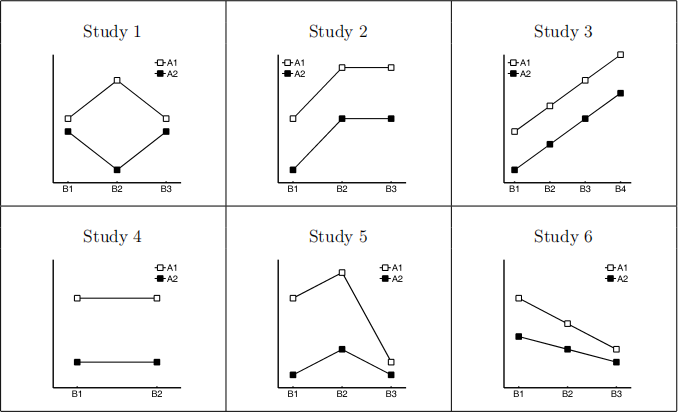
b) Is it possible to have a set of data with two factors in which neither main effect was significant but the interaction was? Explain your answer in detail, supplemented with one or more illustrations. (4 points)
Question 2) A researcher examined the performance of participants in five different types of visual perception task called Task A, Task B, Task C, Task D and Task E. There were 40 participants in total, with 8 assigned to each of the different tasks. The results of this study are shown in the table below, with higher numbers indicating better performance. For the purpose of this exercise you can assume that the data are normally distributed and that the variance is approximately equal across all conditions.
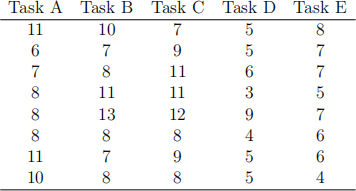
a) Perform an appropriate analysis to determine whether performance differed across the tasks. (14 points)
b) If the data had not been normally distributed and/or the variance had differed sub- stantially across the conditions could you still have used the analysis that you performed in (a) above? If not, name an appropriate alternative analysis. (2 points)
Question 3)
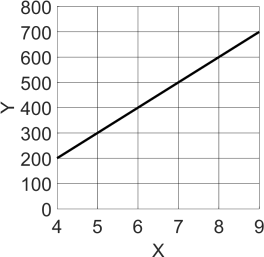
a) Calculate the regression equation for the regres-sion line shown in the figure on the right. (6 points)
b) Given the following regression equation
![]() = 436x + 367
= 436x + 367
calculate the predicted value of Y when x = 17 (1 point)
c) A researcher obtains a correlation r of -0.5878 between two variables x and y. The standard deviation of x was the same as the standard deviation of y. Do you have enough information to calculate the slope of the regression line? If you think you do have enough information, calculate the slope and explain why it can be calculated including relevant equations in your answer.If you do not think that there is enough information, explain what additional information would be needed, along with reference to relevant equa- tions. (6 points)
d) A researcher obtains a correlation coefficient of 0.796 for the relationship between number of hours studied and interest in a topic. What percentage of variance in interest is predictable from the number of hours studied? (3 points)
![]()
![]() Question 4) A researcher was interested in the attractiveness of different logo designs. She surveyed 400 people, asking them to pick which of four different logos they preferred. The percentage of people who chose each of the logos is shown below.
Question 4) A researcher was interested in the attractiveness of different logo designs. She surveyed 400 people, asking them to pick which of four different logos they preferred. The percentage of people who chose each of the logos is shown below.

a) Use an appropriate analysis to determine whether there is a significant difference in logo preference. (12 points)
b) If you did not know the total number of people who had been surveyed, would you still have been able to perform a suitable analysis and if not why not? (4 points)
Question 5) A researcher measured how long it took to the nearest second to solve four different types of reasoning problems labelled Type A to D. Each participant completed each of the four problems and condition order was counterbalanced across participants. Assume that the data (shown below) are NOT normally distributed and that the vari- ance differs substantially across conditions.

a) Name and perform an appropriate analysis to determine whether the solution time differed significantly across the four problem types. (12 points)
b) What is the main disadvantage of non-parametric tests compared to their parametric equivalents? (2 points)
c) A researcher collects data in two conditions (A and B). One group of participants completed Condition A and a different group of participants completed Condition B. The researcher finds that the data are not normally distributed and that the variance of the scores in Condition A is MUCH larger than the variance of the scores in Condition
B. Name the most appropriate test to determine if condition had a significant effect and justify your answer briefly (2 points)
2023-03-25