Future Medical Data Analysis through Data Cleaning and Image Processing
Hello, dear friend, you can consult us at any time if you have any questions, add WeChat: daixieit
Future Medical Data Analysis through Data Cleaning and Image Processing
1. Background
Autonomous knowledge extraction pipelines, decision support mechanisms, and advanced medical diagnosis assistance systems are fast becoming a reality in day-to-day healthcare services. Multimodal data processing and cleaning is thus more important than ever as several modalities of data, including electronic medical records, radiology images, and genetic repositories, among others, contribute to digital health tools.
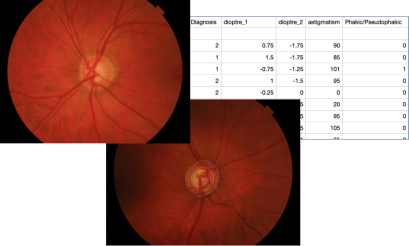
In this assignment, we are dealing with a set of medical data and fundus images of both eyes of a number of patients. Some of these images and clinical data are of healthy individuals and some are from patients diagnosed with Glaucoma, which is known to be an ophthalmological disease that frequently leads to a loss of vision. While past studies have isolated a number of anatomical parameters of the optic nerve that can predict glaucomatous damage, there is no definitive test that can diagnose the disease by itself.
Note that while the data you will be working with in this assignment consists of clinical data, you do not need any specific domain knowledge to complete this assignment . You will take up the role of a data scientist who is expected to prepare the data for downstream
applications, just as actual data scientists do on a daily basis.
The data used in this assignment consists of the following:
● Images of both the left and right eye, centred at the papilla. The images are colour images with a resolution of 256×256 pixels.
● Age and gender of each patient.
● Diagnosis, consisting of healthy, suspicious and glaucomatous
● Crystalline lens, which clarifies whether the crystalline lens has been removed or whether the eye still contains the lens. This information is saved in the column named Phakic/Pseudophakic.
● Refractive error. This refers to the issue caused by the shape of the eye that does not bend light correctly and keeps light from focusing correctly on the retina, resulting in a blurred image. The main types of refractive errors are myopia (near-sightedness), hyperopia (far-sightedness), presbyopia (loss of near vision with age), and astigmatism. A person with myopia would have a negative refractive error, a person with emmetropia would have zero refractive error and a person with hyperopia would have a positive refractive error. Note, once again, that you do not need any expert domain knowledge in this area to complete this assignment.
● IOP (Intraocular pressure) is the fluid pressure of the eye. Pneumatic and Perkins are two different ways of measuring IOP. For both of them, normal values for healthy patients range from 10 mmHg to 21 mmHg.
● Corneal thickness, measured via pachymetry (using a medical device you might have seen if you have had your eye examined).
● Axial length is the distance between the centre of the cornea and the central area of the retina in the posterior pole of the eye and is typically approximately 24 mm in adults.
● Mean defect (MD) of both eyes, which provides an overall value of the total amount of visual field loss compared to the normal sensitivity expected for the population group with the age of the patient.
Note once again that you do not need any expert domain knowledge to complete this assignment. This information might seem alien to a data scientist, but the preparation and initial analysis of data does not require in-depth familiarity with the subject area and is a routine part of the job of any data scientist. So, do not feel intimidated by the medical jargon or the particular features of the dataset as they are not relevant to the completion of this exercise.
2. Scenario
You are a data scientist who has been hired by an eye clinic to perform some clinical data cleaning and image processing.
3. Data Cleaning and Analysis (45%)
The clinical data includes the diagnosis of 244 patients. The information of the patients is stored in spreadsheet format in 3 separate files, two for the right eye (OD) and one for the left eye (OS). The acronyms OD and OS refer, respectively, to the right eye and to the left eye in Latin, i.e., Oculus Dexter and Oculus Sinister.
Based on these three spreadsheets, you are expected to solve a number of problems. Use seaborn (Other visualization liberalises are not allowed, except for using Matplotlib to specify figures’ size) and pandas to support the data processing and analysis.
The whole report addressing the following 3 problems should be no more than 800 words. (This limit does not include references.) The zip file submission should include both the report (a PDF document with your 6-digit user ID as its name) and the python program (a .py/.jpynb file including your user ID in its name); otherwise, you will lose marks.
Problem 1. (10%)
Study these three provided xlsx files and then write a python program to merge od1.xlsx and od2.xlsx into a new file called “od.xlsx” . The file “od.xlsx” should have the same structure as “os.xlsx” . Explain in your report how you deal with the data merging.
Problem 2. (15%)
Use the data cleaning methods you learned in the lectures to clean and process the od.xlsx and os.xlsx and save to another two files called “od_cleaned.xlsx” and “os_cleaned” .xlsx Note: if the axial length is missing, you can replace it with the clinically default value of 26.
Problem 3. (20%)
Based on the data in “od_cleaned.xlsx” and “os_cleaned” .xlsx, explore the difference between healthy and glaucomatous patients with the support of visual graphs. In your report, discuss the information in the graphs and explain the conclusion.
4. Image Processing (45%)
The files for this component of the assignment contain 40 images in the directory:
“image-processing-files/test_images/”
You also have access to a python script “classify.py” which uses the model weights “classifier.model” that is used, in part, to evaluate your results.
The 256×256 images are test images which the eye clinic that has hired you uses to evaluate the performance of their autonomous decision support systems. In our scenario, the clinic has created an AI system which contains an image classifier that receives as its input the fundus image of an eye, either left or right, and predicts as its output a binary label, which identifies the images as healthy or not healthy (the ‘not healthy’ label includes labels for both glaucomatous and suspicious diagnoses - the model is a binary classifier).
The classifier is already pre-trained, frozen and cannot change. You are not expected to design or train a model or perform any machine learning of any kind. Your job is to process the test image data that is to be passed to this image classifier.
These test images, however, suffer from a variety of issues caused by a broken capture device in the clinic (not really, the images have actually been corrupted artificially). These issues include:
- Noise: the images contain significant amounts of gaussian and salt/pepper noise.
- Warping: the images are distorted. This issue can potentially be resolved using projective transformations, so that objects within the images look as they should.
- Contrast/brightness: the contrast and brightness of the images are not adjusted and the details in these images are not visually clear.
- Colour channel imbalance: the information contained within the colour channels of the images is not balanced - i.e. some channels might be darker/brighter than others.
- Missing region: a circular portion of the image at the bottom of right of all images in missing. This can be filled in using various inpainting methods.
Your task is to enhance the quality of these images using image processing techniques. Your results will be judged based on two factors:
1) visual quality of the images, as seen by a human observer (i.e., me!).
2) performance of the pre-trained classifier using your result images. The classifier is now basically guessing (a roughly 50% performance) on the images as they are now. Performance of 95% is achievable. The script that runs the classifier is provided “classify.py” which uses the model weights “classifier.model” .
4.1. Hints
Here are a few hints to help get you started:
● Please read the submission instructions carefully. Since part of the marking will be automated, deviations from the instructions might lead to you losing marks as a result of simple submission mistakes.
● You will notice that during the warping process, only the perspective was affected.
● You can see that multiple types of noise are added to the image at the same time (Gaussian, Salt and Pepper, etc.)
● If you carefully inspect the images, you will notice that both their contrast and their brightness have been affected by the corruptions.
● You will notice that the missing region is always in the same spot on the images, so the mask that has created this “hole” will be constant for all images
● You can complete the missing region of the images using various inpainting techniques. These include simple filling techniques such as filing pixel values with the average of their neighbours, using image inpainting techniques already built into OpenCV:https://docs.opencv.org/3.4.18/df/d3d/tutorial_py_inpainting.html
or any number of more advanced techniques:
https://www.irisa.fr/vista/Papers/2004_ip_criminisi.pdf
Make sure you carefully explain the inpainting method you use in your report.
● Though using the techniques covered in the lectures will get the task done, you are not limited to what was already covered. You will even get extra credit for finding more advanced, obscure and state-of-the-art techniques or proposing new processing methods that perform the required tasks.
4.2. Code Specifications
● Your program must operate with OpenCV 4.1.x on the lab PCs.
● Your program must contain an argument parser in the main script that allows a directory containing images to be specified. I should be able to run your program in the following way:
python main.py image-processing-files/test_images/
from which it will cycle through the images in the specified directory, perform all the processing and save the images without changing the filenames in a directory called “ results” . The contents of this directory will also be a part of your submission.
● Do not submit a Jupyter Notebook. Your final submission should only contain .py files.
You may have multiple files, but the final program should be run through main.py.
● Your program should save the images in the same resolution as originally provided.
● You are not allowed to use any other image classification methods other than the pre- trained classifier provided for this assignment to measure the performance of your work. Only this script will be used during the marking.
● Your program will also be used to transform a set of 5 unseen images (intentionally withheld from you) as well as the images in “test_images” directory provided.
4.3. Submission
● Full program source code together with any required additional files for your final solution to the above task as a working python script, meeting the above “code specifications” for testing. Include all supporting python files and clear description of the code (e.g. in a README.txt).
● A directory called “Results” which contains the results of your image enhancement techniques on the corrupted test images. Do not change the name, format or the resolution or the images.
● Report (max. 750 words) detailing your approach to the problem and the success of your solution in the tasks specified. Provide any illustrative images (as many as you feel necessary) of the intermediate results of the system you produce (overlays, results of processing stages, etc.). Any images, titles, captions, tables, references, and graphs do not count towards the total word count of the report. Summarise the success of your system in enhancing the quality of images and the effects of your image processing techniques on improving the performance of the downstream classifier on the test data set. Submit a PDF (not in any other format).
4.4. Marks
The marks for the image processing component will be awarded as follows:
● Visual quality of the submitted images 10%
ask yourself questions like these before submitting your results:
○ Has the noise been removed from the images?
○ Is the missing region “plausibly and realistically” filled?
○ Have the images been successfully dewarped?
○ Are details in the images visible?
○ Are the images blurry?
○ Don’t limit yourself to these questions though, ask more!
● Performance of the image classifier on the submitted images 10%
● Clear and well documented code that works on unseen test images 5%
● Report:
○ Discussion/detail of solution design and choices made 5%
○ Qualitative and quantitative evidence of performance 5%
● Additional credit will be given for one or more of the following:
○ design and use of an alternative or novel methods
○ use of heuristics or advanced processing to improve performance
○ significant improvements in the performance of the classifier
○ novelty or quality of output for the inpainting technique used
(for any of the above, up to a maximum, dependent on quality) 10%
Total: 45%
5. Data Cleaning and Image Processing [shared component] (10%)
For this part of the assignment, you will need to use both your data cleaning and image processing skills. You are going to calculate a score for each image based on the clinical data, which can help the diagnosticians in the clinic in their jobs.
You will have noticed that the image file names include an ID which can be matched to the identifier in the clinical data. The clinical data includes the Axial Length which you will need
in order to calculate our new diagnosis score, which we will henceforth call “the Score” . You should follow the following steps to calculate the score:
1. Extract the axial length for each image.
2. Calculate the size adjustment ratio by dividing the axial length by the number 26 (clinically default value). e.g., if the axial length of an image is 23.66, then the ratio is 23.66/26 = 0.91.
3. Crop the images down to half the size from the centre of the image multiplied by the ratio you calculated in the previous step. Given that the images currently have a resolution of 256×256 pixels, half of the size would be 128×128 and this multiplied by 0.91 would be 116.48, which we can round to 116. So the image with the axial length of 23.66 should be cropped to 116×116 pixels from the centre of the image. This way if the axial length is 26, then the image is cropped to 128×128, if the axial length is smaller than 26, then the cropped image should be smaller than 128×128 and if the axial length is greater than 26, then the cropped image should be larger than 128×128. Note that the accuracy of this step is crucial in getting the score right.
4. Apply Otsu thresholding to the cropped image to obtain a binary image consisting of
only black and white pixels - you can learn about what Otsu’s method on Wikipedia
https://en.wikipedia.org/wiki/Otsu%27s_method
And in this simple example in OpenCV:
https://docs.opencv.org/4.x/d7/d4d/tutorial_py_thresholding.html
5. After Otsu’s algorithm has been applied, divide the number of white pixels by the total number of pixels - this is the score we are looking for.
6. Create and submit a CSV file that contains two columns - one column with the header “image” and one column with the header “score”. Populate the “image” column with the name of the image files (including the .jpg file extension - e.g. im01- RET029OD.jpg) and fill the “score” column with the scores you have calculated. Make sure the CSV file is formatted correctly as this component of the coursework will be marked automatically and issues in the formatting of the CSV file will break the automation.
It would be interesting to know that the process you will implement is a (highly) simplified version of the actual process used to aid decision support systems in eye clinics.
Plagiarism: You must not plagiarise your work. Attempts to hide plagiarism by simply changing comments/variable names will be detected. You should have been made aware of the Durham University policy on plagiarism.
Submissions should be made through the Gradescope system and you should make sure that the data cleaning and image processing parts are clearly identified so they can be separated for marking purposes.
2023-03-22