PS106 Week 2 – Lab 4
Hello, dear friend, you can consult us at any time if you have any questions, add WeChat: daixieit
PS106 Week 2 – Lab 4
Comparing within groups
|
The aim of this session is for you to practice carrying out (and interpreting) a paired-samples t test. We will use SPSS and Excel during this session. |
Example 1. Comparing event-related potentials to emotional faces
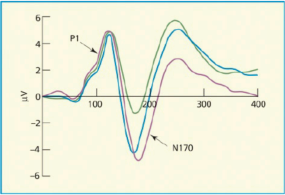
Our first example comprises data from an EEG experiment, a technique which you have learned about elsewhere in the module. To analyse EEG signals, researchers average across many repeated measures, and they often look at changes to key event-related components (i.e., changes in the electrical activity which occur at a particular time relative to something happening in the experiment). One such component is the N170, a negative change which happens about 170ms after participants see a face.
Download PS106week2_N170.sav from the PS106 course (under Week 2 Labs). Open the file in SPSS. The dependent variable in this file is the peak amplitude of the N170 in microvolts (i.e., the “strength” of the brain response to the face). The researchers wanted to see whether this rapid brain response was affected by the emotional expression of the face.
(a) Look carefully at the different columns in the spreadsheet, and their labels in the Variable view
(i) How many within-subjects conditions were there, and what were they?
(ii) What is an appropriate null hypothesis for this example?
(b) We can use the following commands to carry out a paired-samples t test on this data.
> Analyze
> Compare Means
> Paired-Samples T Test
Click N170 for Neutral into Variable 1 in the Paired Variables box Click N170 for Angry into Variable 2 in the Paired Variables box
Click OK
(i) Which condition produced the strongest N170 response? (Note: here a more negative number means a stronger response)
(ii) Was the comparison between conditions statistically significant? Write a sentence reporting
the outcome of the test.
(iii) The SPSS output also shows the correlation between the two conditions. Use what you have
learned in PS105 to perform a (bivariate) correlation between Neutral_N170 and Angry_N170. You should be able to confirm that you get the same value for the correlation coefficient.
(iv) How would you describe this correlation?
(c) We can work out Cohen’s d as a measure of the effect size for the difference between our two N170 samples.
(i) Calculate the effect size by taking the difference between the means in Neutral_N170 and Angry_N170 and then dividing by the standard deviation from Neutral_N170. Write down your value here.
(ii)
SPSS can also calculate Cohen’s d. Repeat the t-test and make sure that the option marked Estimate effect sizes is ticked. Select Average of the variances as the standard deviation to divide by. The estimated effect size is given in the Point Estimate column (see below). It will be different from the one you calculated in part (i).

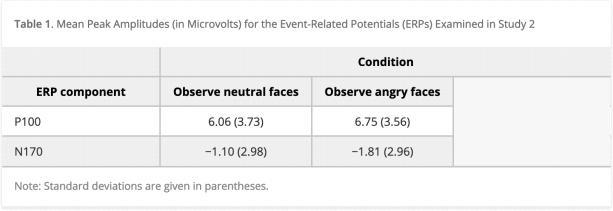
(iii) Blechert et al. (2012) also compared N170s to neutral and angry faces. Part of the table that
they report in their results is shown here. Use these results to calculate Cohen’s d for their data (again, use the standard deviation for the neutral sample). How does our effect size compare to theirs?
|
Note: As you can see in SPSS, there are different ways to calculate Cohen’s d when using within-subjects data. Some people report what Cohen called dz, which uses the standard deviation of the difference scores and is most similar to the values which are incorporated into a paired samples t-test. Others prefer to use the standard deviation of the samples, which makes this directly comparable to the independent samples case (Lakens, 2013) . It’s a good idea to report which version is being used . For example, we could write “The effect size, calculated using the average standard deviation, was d= 0.384 which is a small-to- medium effect.” |
(d) Look again at the information in the spreadsheet.
(i) The researchers included another, between-subjects variable which they could examine with an independent samples t-test. What was this variable?
(ii) In fact, there is a problem with performing this comparison. Can you spot the problem?
(e) For extra practice, in your own time, you could return to this question and repeat questions (a), (b) and (c) but for the comparison between Neutral_N170 and Happy_N170. What is the effect of happy expressions on the N170?
Example 2. Testosterone and responses to threat
As you have learned in your lectures, it has been suggested that the hormone testosterone is associated with aggression and responses to threatening stimuli. Van Honk et al. (2001) examined this with a study in healthy female participants.
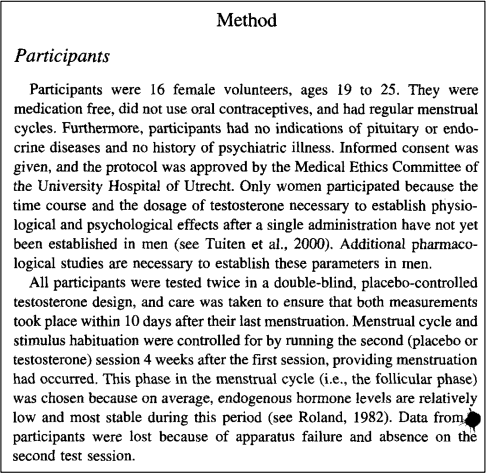
(a) Read the following extract from Van Honk et al’s Method section. What sort of design was their study? What are the advantages of this type of design? Ask your instructors if there are details here that you don’t fully understand.
For this example, we will first open the data in Excel. Open the file PS106week2_testosterone.xlsx. This file shows the change in heart rate a few seconds after seeing an angry face.
(b) We need to re-organise this data so that the conditions are together and so it is in a suitable format for a paired-samples t-test.
First, we want to make two new columns which will contain data for each participant separately in the two conditions. At the top of an empty column (such as column G), type “Placebo” and then in the next column “Testosterone” .
The data in the spreadsheet is in a randomized order, but we can sort it so that the conditions are together. In Excel, click somewhere in the main table and then click >Data > Sort… In the column next to where it says “Sort by”, select the “Condition” column and click OK.
You should now have all the Placebo scores together, and all of the Testosterone scores together. Copy the scores from the first condition (the first 16 rows of the data) and paste them into your new column. Copy the scores underneath and paste them into the second new column.
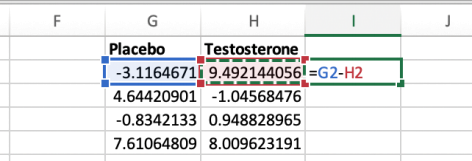
We can also use Excel to calculate the difference between conditions. In a third new column, type a formula for the first participant by typing “=” and then click on the Placebo score, type a minus sign, and then click on the Testosterone score and press enter. Your spreadsheet should now look like this.
Copy the formula down for all participants (by clicking and dragging the small square in the bottom right corner of the formula cell).
Finally, create a new data sheet in SPSS. Copy the two columns and paste them from Excel into SPSS. (You do not need to include the headings or the difference scores). Use the Variable view to name the two columns something sensible.
(c) Carry out a paired-samples t-test to examine the difference between Placebo and Testosterone groups. (You can check the full results in the answers at the back of this handout)
(i) What do you conclude from this experiment?
(ii) If you look back at Van Honk et al’s Method, you will see that they lost some participants
because of “apparatus failure” . How many participants did they lose? (Hint: you can tell by looking at the degrees of freedom as well as looking back at the raw data).
(iii) The SPSS output displays the mean of the paired differences (as well as the standard
deviation and standard error of these differences). We can also work these out in Excel.
Go back to Excel and write an “=AVERAGE()” formula under the difference scores. You will need to delete any error cells which appear because of missing participant data. Confirm that the average difference score here is the same as that in the SPSS table.
(iv) Which participant showed the greatest effect of testosterone?
Example 3. Moral dilemmas and fMRI
The last example in Lecture 5 (Example B) came from the study by Greene et al. (2001) in which participants responded to different types of moral dilemma while in an fMRI scanner. Download the data from moodle (PS106week2_morality.sav) and replicate the analysis from the lecture handout. Perform additional t-tests including for the NonMoral condition. What do you find?
References
Blechert, J., Sheppes, G., Di Tella, C., Williams, H., & Gross, J. J. (2012). See what you think: Reappraisal modulates behavioral and neural responses to social stimuli. Psychological Science, 23(4), 346-353.
Greene, J. D., Sommerville, R. B., Nystrom, L. E., Darley, J. M., & Cohen, J. D. (2001). An fMRI investigation of emotional engagement in moral judgment. Science, 293(5537), 2105-2108.
Lakens, D. (2013). Calculating and reporting effect sizes to facilitate cumulative science: a practical primer for t-tests and ANOVAs. Frontiers in psychology, 4, 863.
van Honk, J., Tuiten, A., Hermans, E., Putnam, P., Koppeschaar, H., Thijssen, J., ... & van Doornen, L. (2001). A single administration of testosterone induces cardiac accelerative responses to angry faces in healthy young women. Behavioral Neuroscience, 115(1), 238.
Selected answers
1. (a)
(i) There are 3 within-subjects conditions: Neutral, Happy and Angry faces.
(b)
(i) The Angry condition
(ii) The N170 response was significantly stronger in the Angry condition than in the Neutral condition, t(24) = 3.02, p = .006.
(c)
(i) 0.41 (the sign, positive or negative, doesn’t matter here)
2. (c)
|
t value |
Degrees of freedom |
p value |
Significant? |
|
2.23 |
13 |
0.044 |
Yes |
2023-03-22