STA2201H Winter 2023 Assignment 3
Hello, dear friend, you can consult us at any time if you have any questions, add WeChat: daixieit
STA2201H Winter 2023 Assignment 3
What to hand in: .Rmd/.qmd file and the compiled pdf, and any stan files
How to hand in: Submit files via Quercus
1 Fertility intentions
This question relates to a 2016 survey of US women who were asked about their future fertility intentions. The survey data is in the file intentions_survey. Also relevant to this question is the us_pops data file, which contains the number of women in the US in 2016 by age group, education and marital status.
For this question, we are interested in obtaining estimates of pa, which is the probability that a woman in age group a wants to have children in future, for all age groups a = 1, . . . A. In this case we have a total of A = 5 age groups (20-24, 25-29, 30-34, 35-39, 40-44).
a) Make a plot which compares the proportions surveyed women by age, education, and marital status to the same proportions in the overall US population. Briefly comment on what you observe.
b) Calculate the proportion of survey women in each age group that want to have children. We will refer to this set of estimates as pˆa(r)aw for each age group a.
c) Calculate the post-stratified estimates
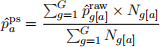
where g refers to a particular education/marital status group (e.g. people who are married and have less than a high school degree). There are a total of G = 5 ◊ 3 = 15 groups within each age group. Note that pˆg(r)a[wa] refers to the observed proportion of women in group g who are aged a who want more children and Ng[a] refers to the size of that particular population group who are aged a in the US population.
e) Fit the following hierarchical model
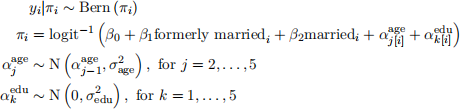
where yi = 1 if respondent i wants more children and 0 otherwise, and the formerly marriedi and marriedi variables are indicator variables. Note you will need to specify priors on —0 , — 1 , —2 , –1(a)ge and the variance parameters. Create a plot of the estimated age effects.
e) Calculate the multilevel-regression-with-post-stratification (MRP) estimates
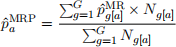
where pˆMg[Ra] is the proportion of women in group g who are aged a who want more children estimated from your model in d). Report the median estimate of each pˆa(M)RP as well as the
95% CIs.
f) The true proportions of women wanting more children by age group are listed in fertility_intentions_true. Report the absolute difference by age group for each of the estimates pˆ![]() pˆa(p)s and pˆa(MRP), as well as the mean absolute difference across all age groups. Comment on what you observe based on the relative performance of each of the estimation approaches.
pˆa(p)s and pˆa(MRP), as well as the mean absolute difference across all age groups. Comment on what you observe based on the relative performance of each of the estimation approaches.
2023-03-20