REHABILITATION ENGINEERING LABORATORY 2
Hello, dear friend, you can consult us at any time if you have any questions, add WeChat: daixieit
REHABILITATION ENGINEERING LABORATORY 2
MOTION ANALYSIS
OBJECTIVES
The aim of this laboratory exercise is to familiarise yourself with motion analysis and its applications in rehabilitation.
At the end of this session, you should
• have an understanding how motion analysis works and how it can be used to track single joint motions,
• be able to set up a Kinect based motion tracking system,
• be able to determine anatomically relevant data (such as limb segment length and joint angle) from coordinates recorded by the motion analysis system,
• appreciate the limitations of 2D motion analysis, and the advantage of 3D analysis,
• understand how to determine the range of motion of a single joint (e.g. the elbow).
LABORATORY REPORT
You are required to hand in a lab report for this lab, describing your results and summarising the main findings. The report must be written individually, using the results from your group. It should be approximately one A4 page of text, excluding any graphs and tables.
In your report, you should address the questions raised in the section Data Analysis on page 6 of this handout.
The lab reports for Lab 2 must be submitted as an Assignment on Moodle (see Topic Laboratory on the Moodle page) within 2 weeks of your lab date.
SETUP
The setup consists of a MS Kinect device which is connected to a lab PC running MATLAB / SIMULINK.
The Kinect can detect and track skeletal joints without the use of any markers or special equipment on the user. Inferring the body position is a two stage process. Firstly, a depth map is produced using structure light, which is the technique of analysing a known pattern. The Kinect projects a laser dot pattern onto the user and their environment. These projected points create a depth map. This depth map is then used to fit a skeleton model. Secondly, utilising the depth map the algorithm provides a guess of the joint for each of the points on the depth map along with a confidence level of each guess. Following that, it chooses a skeleton that is most likely to fit the guesses for the joint position. A representation of the internal skeleton model together with the location of the joints is shown in Figure 1.
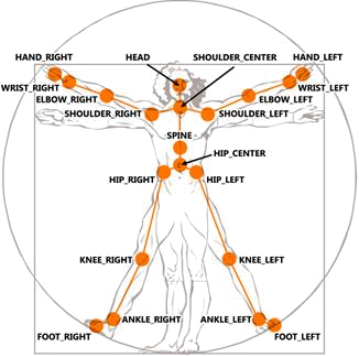
Figure 1: Skeletal model.
In this lab, a Simulink diagram will be used to connect to the Kinect SDK to access the image information (for display on the screen) and the location information for the estimated skeletal joint positions.
A total of 20 skeleton joints are tracked. For our setup, the Kinect is used in “seated mode” where it only tracks the upper body joints and infers that the skeleton being tracked is sitting down. Furthermore, the system is used in “near mode” which provides a useful tracking range of 0.4m to 3m from the device.
The index number of skeleton joints data represents their location is shown below follows (see also Figure 1). If a XYZ joint data is [0 0 0], it means that the joint position could not be recognized.
1 = Hip center,
2 = Spine,
3 = Shoulder centre,
4 = Head,
5 = Shoulder left,
6 = Elbow left,
|
7 = |
Wrist left, |
|
8 = |
Hand left, |
|
9 = |
Shoulder right, |
|
10 = |
Elbow right, |
|
11 = |
Wrist right, |
|
12 = |
Hand right, |
|
13 = |
Hip left, |
|
14 = |
Knee left, |
|
15 = |
Ankle left, |
|
16 = |
Foot left, |
|
17 = |
Hip right, |
|
18 = |
Knee right, |
|
19 = |
Ankle right, |
|
20 = |
Foot right. |
In this lab we will focus on movement of the right arm. Although the location of all detected joint markers will be visible on the screen, the model is set up to only output the coordinates of the four joints highlighted in the list above.
Figure 2 shows the coordinate system used by the Kinect. Each joint position is given as a relative distance to the centre of the camera, using real-world units [metres].
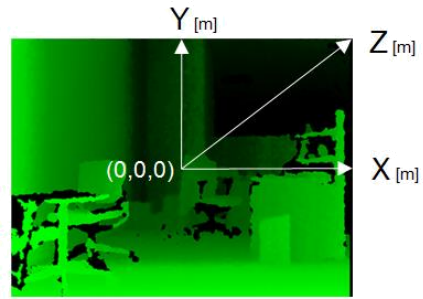
Figure 2: Coordinate system.
The procedures in this lab require one group member to be the volunteer on whom measurements are being carried out. You should complete all exercises with the same volunteer. If there is time left you can repeat part of the exercises on different volunteers to gain more experience.
PROCEDURES
SETUP & FAMILIARISATION
Open the folder RehabEngLab on the Desktop. In this folder, open Lab 2 and click on RehabEng Lab2 MATLAB. This will start Matlab and open the Simulink model lab2.slx which is setup for collecting data.
Familiarise yourself with the model structure, and try to understand the purpose of each block. When you double click on a block, a parameter window opens which has a Help link which provides detailed information about its functionality.
Start the Simulink model and observe the RGB image. The volunteer should position themselves in such a way that their upper body is visible in the image, including their right arm when it is fully abducted (see Figure 3) and when it is raised.
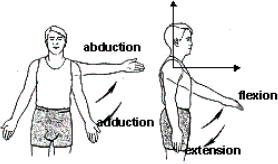
Figure 3: Shoulder abduction/adduction and flexion/extension.
The software might take a few moments to display an outline of the image together with the estimated joint positions in the 2nd video viewer window. To speed up this process you should stretch out both arms as shown in Figure 1; this makes it easier for the software to detect the shape of a human body.
Identify the markers (shown as yellow crosses) corresponding to the different upper body joints and relate this to the joints listed above and shown in Figure 1.
Depending on the background colour these markers may be difficult to see. In this case just restart the simulation as the software will randomly choose a different colour.
Perform some simple movements and stop the simulation.
You will now have variables corresponding to the four joints (shoulder, elbow, wrist, hand), together with time, in the workspace (they are saved from the blue blocks in the Simulink model). Each of the four joints will be represented by a matrix containing three columns, corresponding to the x, y and z coordinates, respectively. Each row of the matrix corresponds to a sample point.
Using the plot() command, you can now display how these coordinates change with time.
Use the Matlab cheat sheet provided for some basic command, and Matlab’s doc facility for more detailed help.
For example:
plot(time,elbow(:,1))
will display the x-coordinate of the elbow joint over time.
You can also plot the movement of a joint in the x-y space, by plotting the x-coordinate vs. the y- coordinate, e.g.
plot(elbow(:,1),elbow(:,2))
or, for a more interesting plot
comet(elbow(:,1),elbow(:,2))
To make the data analysis for different trials easier, you should write a scrip with your analysis commands.
You should now complete a small number of task (see next page) and record the corresponding data. You should save these data to a mat-file for later analysis. You might consider writing small scripts for saving, plotting and analysis.
You can complete the data analysis after the lab, using any computer with Matlab installed. It is, however, recommended to start analysing the data during the lab so you have a chance to check that the data you have recorded is usable, and to re-record it if required.
TASK 1: ELBOW FLEXION/EXTENSION
The aim of this task is to collect data about the range of motion of your elbow joint.
Start with a fully abducted arm and flex your elbow so that your hand moves upwards and towards you., Make sure that all the relevant joints can be tracked.
From the data collected, you should calculate (as functions of time) :
• The detected length of the two arm segments (shoulder-elbow, elbow-hand), using
a) the x and y coordinates only (ignoring z), and
b) the x, y and z coordinates.
• The angle of the elbow joint, using only the x and y coordinates.
Use the guidance provided in the Appendix for these calculations.
Repeat the movement (at least) five times and compare the measurements during each movement. Don’t forget to save the recorded data!
Measure the lengths of the two arm segments using the measurement tape provided. Compare these values with those calculated from the Kinect data.
Based on the elbow joint angles which you have determined, you should now be able to determine the range of motion (ROM) of this joint, i.e. the angle between the fully extended and the fully flexed position. The ROM is often used as a clinically relevant measurement for diagnostics of movement limitations.
TASK 2: SHOULDER ABDUCTION/ADDUCTION – RAISING/LOWERING THE ARM
The aim of this task is to collect data which relate to the movement of your stretched arm.
You should raise and lower your stretched arm slowly. Make sure that during the task, your arm is fully visible by the Kinect camera, so that your shoulder, elbow, wrist and hand can be tracked.
From the data collected, you should calculate:
• The detected length of the arm, and how this evolves as the arm moves, using
a) the x and y coordinates only (ignoring z), and
b) the x, y and z coordinates.
• The angle of the arm (relative to the horizontal position), using only the x and y coordinates. Note that you will first need to define the horizontal reference vector when calculating the angle.
Use the guidance provided in the Appendix for these calculations.
Measure the length of the shoulder-hand segment using the measurement tape provided. Compare this value with those calculated from the Kinect data.
Repeat the movement (at least) five times and compare the measurements during each movement.
You might also want to move the arm towards the Kinect to evaluate how accurate the detection in z-direction is.
DATA ANALYSIS
In your data analysis you should consider the following points. You can discuss these in your lab group, but you should address them in your own word in your individual lab report!
• How well do the segment lengths obtained from the Kinect data correspond to the values obtained with the measurement tape?
o Is there a difference between the accuracy when you only consider 2 dimensions (i.e. the x and y data), compared to when you consider all three coordinates?
• Do the segment lengths obtained from the Kinect change over time? Explain why?
• Do the joint angles calculated from the Kinect data correspond to what you expect? Do they vary with time?
• How much do the measurements vary with time (e.g. reporting means and standard deviations)?
• What external factors may have influenced your measurements?
APPENDIX
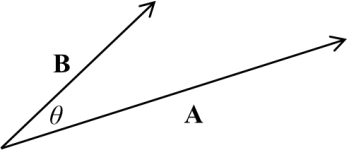
To analyse the joint angle, you will first need to define the two vectors (A and B) which correspond to the two limb-segments (elbow-shoulder and elbow-wrist) or the limb segment (shoulder-wrist or hand) vs the reference vector.
The dot product of two vectors A and B is directly proportional to the angle between those vectors, A . B = |A||B|C![]() Se. This relationship can be used to calculate the angle between vectors A and B.
Se. This relationship can be used to calculate the angle between vectors A and B.
In Matlab, you can calculate the magnitude (i.e. length) of a vector |A| either using Pythagoras (which can easily be implemented for many data point without using a for-loop; remember to use a. ^2 to calculate the square of the elements of the matrix a), or using the function norm() which can only operate on a single data vector.
The dot product of two vectors can be calculated using the Matlab function dot().
2023-03-17