COMP 1012 Summer 2021 Assignment 1
COMP 1012 Summer 2021 Assignment 1
Due Friday June 11, 2021, at 11:59 PM
Material Covered
- Weeks 1-4, with a bit of Week 5
Description
You are the long-suffering data analyst for a small sports league. You have just received a data file containing the season’s game results and you are tasked with performing rudimentary aggregation and analysis.
Part 0: Standards
Be sure to follow all programming standards in the document provided on the course website, including comments where appropriate and at the beginning of all files submitted. Remember to include all of your imports at the top of the file.
Make sure to save your python file as LastNameFirstNameA1.py (e.g., SmithJohnA1.py). Marks will be deducted for incorrectly named files.
For each part below, denote where it begins and ends in your code with a big comment, like this:
###################PART ONE START###################
Part 1: Setup
Alongside this file in the assignment folder is a csv file, gameData.csv. Read that file in as a text file and store its contents in a list called allGames using the readlines() method. Remember to close the file after you are done reading it (or use with to open it)
The file contains data from every game of the season, one game per line. The data is in the following format:
HomeTeamName,AwayTeamName,GameNumber,HomeScore,AwayScore,IsOvertime
Where IsOvertime is True if the game ended in overtime and False otherwise. There are no ties in this league.
Part 2: Team Directory
We’re going to create a dictionary to store all the team data. To do that, we need to know all the teams. Unfortunately, we were not provided with a list, so we’re going to have to do this the hard way: by looking through the game data.
First, create an empty dictionary called directory. Then, using a for loop, run through each line of allGames and extract the home and away team names for that game (there are several ways to do this; use whichever one you find easiest). If a team isn’t already in the directory, add it to the dictionary with its value being a list of six zeros.
For example, if you discover that a team called the Hornets isn’t in the directory already, you add it with the following line: directory["Hornets"] = [ 0,0,0,0,0,0]
Part 3: Aggregating Data
Now that we know all the teams, we need to fill in the basic data.
The list we created for each team in the dictionary will hold that team’s information. In order, the six spots in the list represent a team’s regulation wins, overtime wins, regulation losses, overtime losses, goals for, and goals against.
Taking our sample Hornets team again, if we printed directory["Hornets"] and got this result: [4, 2, 5, 1, 21, 15], that would mean that the Hornets have won 6 games (4 in regulation, 2 in overtime), lost 6 games (5 in regulation, 1 in overtime), scored 21 goals, and allowed 15 goals.Loop through allGames again and record the result for each team in that team’s directory entry.
Once you have all the data for each team, calculate the team’s total games played (GP) and points. Points are calculated as follows:
Points = RegulationWins ∗ 3 + OvertimeWins ∗ 2 + OvertimeLosses
These values should be inserted into (not appended after) a team’s directory entry; GP should be inserted at the start and points should be inserted before Goals For.
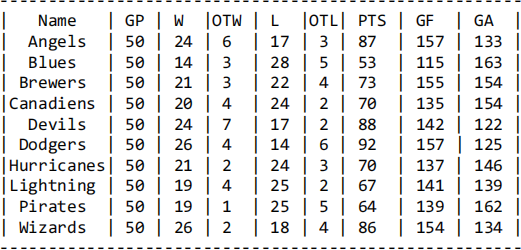
Part 4: Standings
Print the standings for the league, as shown in the sample output below. You do not need to print them in any particular order (bonus marks are available if you can print them in descending order of points).
Shorthand is used in the header:
- W stands for (regulation) wins.
- L stands for (regulation) losses.
- OT stands for overtime.
- GF stands for Goals For
- GA stands for Goals Against
You must use proper print formatting to produce the table. Assume that no team name will be longer than 10 characters and that no team plays more than 99 games, obtains more than 999 points, or scores/allows more than 999 goals.
Part 5: Summary
Calculate and print out the answers to the following questions, as shown in the sample output below. You may assume that there will be no ties for any of these. Round to the same number of decimal places as shown in the sample output.
- Which team won the league (had the most points)? How many points did they have?
- Which team had the largest winning percentage ((regulation + overtime wins) / games played)? What was it?
- Which team had the greatest goal differential (goals for – goals against) and what was it?
- Which team had the largest percentage of their points come from overtime (both wins and losses)?
Part 6: Tricky Questions
These questions are much harder to answer than the ones from part 5. Do not focus on them until the rest of your assignment is complete and do not worry too much if you cannot complete them.
- Which team had the best record against the league champions (in terms of point percentage)?
- Which team had the longest winning streak (most wins in a row without a loss)? How long was it?
- Which team had the longest points streak (most games in a row without a regulation loss)? How long was it?
Part 7: Handin
Hand in your python script and a text file containing your output on umlearn in the Assignment dropbox. Note that sometimes copying your output from Spyder into a text editor (such as Notepad) can result in your string formatting not appearing correctly. You will want to make sure that whatever you are copying into is using a monospaced font (Consolas is a good one but others exist).
Hints
- The csv file is very long, but the concept is the same no matter how long it is. Start by just doing your analysis on the first 10 or so lines of the file and then expand to the full thing once your code works.
- For the printing of the standings, I recommend defining a fmt variable that contains your string formatting and then just repeating calling fmt. format(… ) in a loop.
- You can print a long line of the same symbol by using print("x" ∗ k), where “x” is the symbol you want to print and k is the number of times you want to print it.
- You code should work for any similar CSV file, not just this specific one.
- Here is a useful piece of code that I used several times in my solution (obviously with proper variables)
o blankDict = dict([(ii, 0) for ii in someList])
o Try it for yourself (print the results) to see what it does and how it might be useful
Sample Output
The Dodgers won the league with 92 points
The Devils had the highest winning percentage: 62.0%
The Dodgers had the best goal differential: +32
The Blues received the highest percentage of their points from overtime: 20.8%
The team with the best record against the Dodgers was the Brewers: 2-1-1-0
The team with the longest winning streak was the Angels (8 games)
The team with the longest point streak was the Angels (12 games)
2021-06-15