Intro to Data Science Problem Set 2
Hello, dear friend, you can consult us at any time if you have any questions, add WeChat: daixieit
Intro to Data Science
Problem Set 2
Due: Midnight, March 8, 2023
Submission Mode: Upload to Canvas
Materials to Submit: 1 file made with RMarkdown
Students are to submit a document (html or PDF) produced in RMarkdown which displays all of the code they used to answer the questions, as well as the relevant statistical output and the student’s own discussion of the results.
As a reminder, problem sets will be graded on the basis of the student’s write-up, the accuracy of the student’s code, and, just as importantly, the code’s style—that is, how easy it is to read and how well commented it is. Make sure to format and comment your code!
1. (0 points) Using the read.csv() function, read in surveyA.csv and electoral_votes.csv
Part 1
2. (5 points) Calculate mean trump vote for each state using survey A.
3. (10 points) Calculate the standard errors for the mean trump vote by state. Why is the standard error so much larger (in some cases, nearly 8x as big) for some states than other states?
4. (10 points) Make a plot of Trump vote by state. Your plot should include the following 5 states: California, West Virginia, Michigan, Wisconsin, Pennsylvania. Your plot should have state on the X axis and Trump vote on the y axis. Include 95% confidence intervals on your plot (use geom_errorbar in ggplot).
Note: You will be putting all 5 states on one plot
5. (10 points) Explain in your own words what these 95% confidence intervals from the previous plot represent.
6. (10 points) Your friend says to you, “Your use of the t-distribution to construct that confidence interval was problematic because Trump vote share is not normally distributed.” Craft a response to your friend that explains when and why you might use the t-distribution even if the underlying variable you are studying is not normally distributed.
7. (10 points) Using the t.test() function, determine if the difference between the Trump vote in IL vs. TX is ”statistically significant” at the 0.05 level. Explain what this means.
Part 2
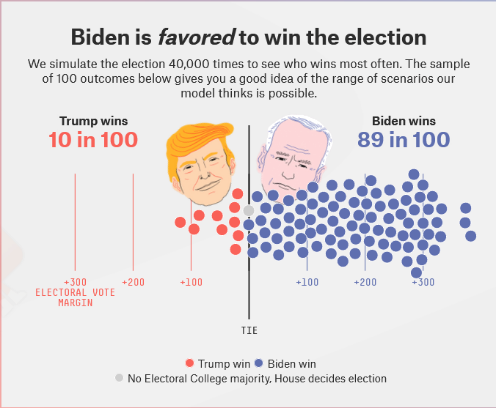
8. (20 points) Now, we’re going to run a simulation to demonstrate the role of sampling variation in polling. When survey researchers conduct a survey, they are drawing a sample of respondents, so they can use the sample mean to estimate the population mean. In this question, we will simulate lots of different samples from Survey A respondents to determine how much variation we will see in our predictions as a result of random chance. We will combine this data with electoral vote counts in order to generate predictions about the 2020 presidential election, similar to the 538 election forecast.

To conduct this simulation, follow the below steps:
First, randomly sample 101 survey respondents from each state (sample with replacement). We’re using 101 in this question so we don’t have to resolve any ties. One way to do this is with a for loop. Another way is to define a function that samples a vector and use aggregate to apply that function to every state.
Second, determine which candidate wins each state and allocate electoral college votes accordingly (for ease of computation, we are going to use winner-take all for each state, don’t worry about ME and NE congressional districts). Sum up the electoral votes won by Trump and store them in a vector as the total electoral vote count for Trump.
Third, repeat the first two steps 1000 times. In the end, you should have a numeric vector that is length 1000, and each value in this vector should be between 0 and 538. The best way to do this is with a for loop.
Hint: This code may take a while to run. My recommendation is that when you are writing a for loop, you focus on getting the inside code right first, then testing it on a small number of i’s (eg i in 1:10) before running it on the full loop (i in 1:1000). Another thing you might want to do in testing is to print(i) in the loop, so you can follow along with the progress in real time (though you should get rid of print(i) in the final rmarkdown document).
9. (5 points) Plot the results of the simulation in a histogram, adding a vertical line for the actual number of electoral college votes won by Trump (232).
Extra credit (5 points): There’s been a lot of talk about problems with polling after the 2016 election, and 2020 was no exception. Often times, these errors are correlated – it’s rare for polling to be terribly off in one state and accurate in others. In this question, we’re going to think about how polling errors shape election predictions.
Assume that polling errors are normally distributed with a mean of X and a standard deviation of 0.01 (1%). Using a for loop, repeat question 8 for X = [0, 0.1] (that is, where the polls underestimate trump vote percent from 0% (0) to 10% (0.1), incrementing by percentage point, so 0%, 1% etc).
To do this question, you will want to draw a vector of normally distributed errors using the rnorm function and add them to the state Trump percentages you calculate in every iteration of the simulation. Note that I say a vector of errors (eg a unique polling error for each state, don’t just add X)
For each value of X, calculate the % probability that Trump gets >270 electoral votes and wins the election. Plot this probability against X (Mean Polling Error on x axis, Probability Trump Win on the Y axis). Make sure you label your axes informatively. According to your plot, how large does the polling error have to be for Trump to have approximately a 50% chance of winning?
2023-03-16