Statistical Modelling 1
Hello, dear friend, you can consult us at any time if you have any questions, add WeChat: daixieit
Coursework – Statistical Modelling 1 – Due at 13:00 on Thursday, 23 March 2022
Ensure that your submission is clearly legible and well-organised.
1. Consider a linear regression model Y = Ⅹ夕 + ∈ with SOA and FR assumptions satisfied. Let P be the hat matrix. Show that rank(P) = rank(Ⅹ). [1 Mark]
2. Plot the density of the χ5(2) distribution and of the F5,7 distribution. Compute the critical values at levels 0.0132, 0.0257, 0.0591 for these distributions, that is compute the cα s such that P (lXl > cα ) = α for α equal to 0.0132, 0.0257, 0.0591 and X distributed as χ5(2) and as F5,7 . [2 Marks]
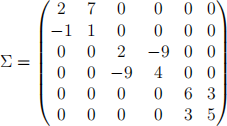
3. One of your friends comes to you and says: "I have a random vector X ~ N(0, Σ) where

Which are the properties of the components of X?" What would you reply to your friend? [2 Marks]
4. Explain with two examples the sentence "the more information we have the more precise our estimates are". [2 Marks]
5. A group of biologists want to understand where Azaleas (a certain type of plants) get phos- phorous from. In particular, they want to understand the relation between the amount of phosphorous in Azaleas (y) with the amount of certain organic nutrients in the soil. We denote these organic nutrients by x1 and x2 . The values are all measured in ppm (parts per million). They consider 17 Azaleas (n = 17). The observations are:
y = (64, 60, 71, 61, 54, 77, 81, 93, 93, 51, 76, 96, 77, 93, 95, 54, 99)
x1 = (0.4, 0.4, 3.1, 0.6, 4.7, 1.7, 9.4, 10.1, 11.6, 12.6, 10.9, 23.1, 23.1, 21.6, 23.1, 1.9, 29.9) x2 = (53, 23, 19, 34, 24, 65, 44, 31, 29, 58, 37, 46, 50, 44, 56, 36, 51)
(a) Consider the linear regression model for such experiment. [1 Mark]
(b) Consider the output of the R command àμmma扌y applied to the linear model. Describe how all the values in such output are computed giving also an explanation on the reason why they are computed in such way. Further, describes the outcome of this experiment based on the values obtained. [3 Marks]
6. A group of economists want to study the income of individuals. To fit their model, they have collected n = 100 individuals and recorded the annual income yi of each individual measured in thousands of pound. The following characteristics were also recorded for each individual: level of education x1,i measured in years spent studying (in school and university), hours per week spent in doing sport x2i, smoker vs non smoker x3,i (in particular x3,i = 1 if individual i is a smoker and x3,i = 0 if individual i is not a smoker ). The economists will use the model Yi = β0 + β1 x1,i + β2 x2,i + β3 x3,i + ∈i , where the errors are i.i.d. and ∈i ~ N(0, σ2 ), where σ is unknown. Assume that the full rank assumption is satisfied.
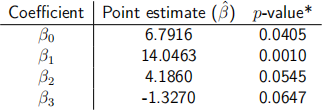
The following information is obtained after using least squares to fit the linear model:

R2 = 0.62 and n = 100.
*All p-values were computed as p = P (lT l > t) for T ~ t96 .
(a) From this statistical analysis, by how much would the income of a person increase if the person studies three more years? Is this significant? [1 Mark]
(b) How would you write down the hypothesis test that smokers earn significantly less than
non smokers? From this statistical analysis, can we affirm that smokers earn significantly less than non smokers? [2 Marks]
(c) The economists would like to add a variable x4,i which takes value 1 when the individual is a not a smoker and 0 otherwise. Which problem would they encounter when trying to do this? How do they solve this problem? In particular, write down a linear regression model where there are both x4,i and x3,i and there is no such a problem. [2 Marks]
(d) Consider now the original model with a further regressor, that is Yi = β0 + β1 x1,i + β2 x2,i + β3 x3,i + β4 zi + ∈i , where zi is the income of the parents of individual i. After performing the statistical analysis, they observe that the coefficient of determination for this new model is equal to 0.78.
(i) Can they conclude that this new model is better than the original one? [1 Mark]
(ii) Consider the alternative measure ![]() := 1 - (1 - R2 )
:= 1 - (1 - R2 ) ![]() , where p is the number of
, where p is the number of
parameters. Is ![]() a good alternative to R2 ? According to
a good alternative to R2 ? According to ![]() is the new model better than the original one? [1 Mark]
is the new model better than the original one? [1 Mark]
(e) Provide four additional regressors that might be good predictors for the annual income of individuals. Of these four regressors two must be dummy variables (i.e. taking values 0 and 1, like x3,i) and one must be continuous (like x1,i and x2,i). Motivate your choice and write down your final linear model. [2 Marks]
2023-03-11