W22 STAT 362 R for Data Science Assignment 4
Hello, dear friend, you can consult us at any time if you have any questions, add WeChat: daixieit
W22 STAT 362 R for Data Science
Assignment 4
Due: 10 Mar 11:59pm.
Instruction:
Q1 (Multiple graphs): The function ggarrange in the package ggpubr can be used to organize multiple
graphs in a single plot. For example,
library(ggpubr) # install this first
library (MASS)
library(tidyverse)
plot_no_smoke <- birthwt %>%
filter(smoke == 0) %>%
ggplot(aes (x = bwt)) +
geom_histogram()
plot_smoke <- birthwt %>%
filter(smoke == 1) %>%
ggplot(aes (x = bwt)) +
geom_histogram()
ggarrange (plot_no_smoke, plot_smoke)

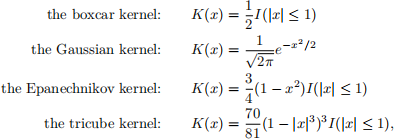
Recall that

where I (|x| ≤ 1) = 1 if |x| ≤ 1 and equals 0 otherwise.
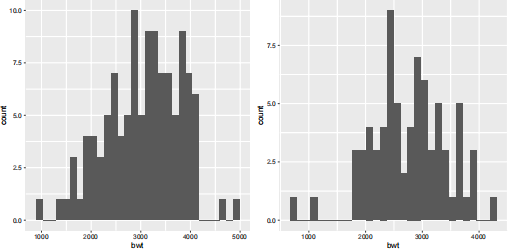
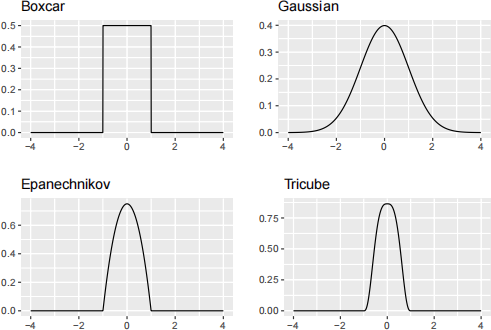
Use ggarrnage to create the following plot.

Q2: The specifications for a certain kind of ribbon call for a mean breaking strength of 185 pounds. If five pieces randomly selected from different rolls have breaking strengths of 171.6, 191.8, 178.3, 184.9, and 189.1 pounds, test the null hypothesis µ = 185 pounds against the alternative hypothesis µ < 185 pounds at the 0.05 level of significance.
Hint: use t .test() and set alternative = "less" (see ?t .test).
Q3: To study the durability of a new paint for white center lines, a highway department painted test strips across heavily traveled roads in eight different locations, and electronic counters showed that they deteriorated after having been crossed by (to the nearest hundred) 142,600, 167,800, 136,500, 108,300, 126,400, 133,700, 162,000, and 149,400 cars. Construct a 95% confidence interval for the average amount of traffic (car crossings) that this paint can withstand before it deteriorates.
Hint: use t .test().
Q4: In a random sample, 35 of 400 persons given a flu vaccine experienced some discomfort. Construct a 95 confidence interval for the true proportion of persons who will experience some discomfort from the vaccine.
Hint: use prop .test().
Q5: Determine, on the basis of the sample data shown in the following table, whether the true proportion of shoppers favoring detergent A over detergent B is the same in all three cities:
|
number favoring detergent A |
number favoring detergent B |
|
|
City C City D City E |
232 260 197 |
168 240 203 |
Hint: use prop .test().
Q6-8 (k-NN): Download the two datasets iris_train .csv and iris_test .csv from onQ (onQ -> Content -> Datasets). Import them to R.
Q6: Perform the min-max normalization on the two datasets iris_train .csv and iris_test .csv.
Q7(a): Perform the k-nearest neighbour classification using knn from the package class with k = 3.
Q7(b): Find out the testing accuracy.
Q8: Type ?knn and read the documentation for knn(). What is the use of prob in the function? Now, set the argument prob = TRUE and redo Q7(a).
2023-03-10