COMP4030 Data Science and Machine Learning
Hello, dear friend, you can consult us at any time if you have any questions, add WeChat: daixieit
Data Science and Machine Learning
COMP4030
Coursework 2023 CW2 Brief
Instructions
For this coursework assignment you will need be required to work in pairs to analyse a data set (select one from the datasets provided or one you create as described) using all the data science steps you have learnt to create and compare your machine learning models.
You will write your work up as a joint academic paper with your coursework partner, comparing and analysing your results at every stage of the data analysis and modelling pathway .
You will need to present your paper in an IEEE format using a template from here:
https://www.ieee.org/conferences/publishing/templates.html
Your paper should be between 6 to 8 pages (including tables, diagrams and references as appropriate) and submitted as a PDF. The diagrams table and diagrams should add value to the writing. Diagrams are preferrable to tables.
Your paper should be organised into 8 parts:
1. Title and Abstract (2.5%)
2. Introduction to the data set and research question(s) (marked as part of interim report 5%, but needs to be included in the full paper for completeness. You might have refined your research questions following the interim submission)
3. Literature Review – covering a few key methods adopted by other researchers who used this or a similar dataset (5%)
4. Methodology – including a justification for your selected approaches for data analysis and pre- processing and data classification. (10%)
5. Results from each of the stages – data analysis, pre-processing and classification (20%) Please note at each partner in the pair should use a different approach for each stage.
6. Discussion - comparing and critiquing each other’s results (partners in pair) and also with other results from previous research on the dataset as noted in your literature review (25%)
7. Conclusions and recommendation for future research (10%)
8. References (2.5%)
Code Submission
Please include all your code as a single Jupyter Notebook with clear comments showing attribution of each student for each section. We should be able to run this to generate your results (20% = each person in the pair will be marked individually on this) in addition to the paper.
The ultimate aim of this coursework is to give you first-hand experience on working with a relatively large and real data set, getting experience of the first stages of data science: data description, exploratory data analysis, to the later stages of knowledge extraction and machine learning.
Please note that you need to include a contributions section in the paper to clearly specify which person worked on what aspects of the paper.
Datasets
You can choose to work on one of the following datasets:
1. Flu Shot Learning: Predict H1N1 and Seasonal Flu Vaccines
https://www.drivendata.org/competitions/66/flu-shot-learning/page/211/
The data comes from the National 2009 H1N1 Flu Survey (NHFS).The National 2009 H1N1 Flu Survey (NHFS) was sponsored by the National Center for Immunization and Respiratory Diseases (NCIRD) and conducted jointly by NCIRD and the National Center for Health Statistics (NCHS), Centers for Disease Control and Prevention (CDC). The NHFS was a list-assisted random-digit-dialing telephone survey of households, designed to monitor influenza immunization coverage in the 2009-10 season.
The target population for the NHFS was all persons 6 months or older living in the United States at the time of the interview. Data from the NHFS were used to produce timely estimates of vaccination coverage rates for both the monovalent pH1N1 and trivalent seasonal influenza vaccines.
Your goal is to predict how likely individuals are to receive their H1N1 and seasonal flu vaccines. Specifically, you'll be predicting two probabilities: one for h1n1_vaccine and one for seasonal_vaccine.
Each row in the dataset represents one person who responded to the National 2009 H1N1 Flu Survey.
Labels
For this competition, there are two target variables:
• h1n1_vaccine - Whether respondent received H1N1 flu vaccine.
• seasonal_vaccine - Whether respondent received seasonal flu vaccine.
Both are binary variables: 0 = No; 1 = Yes. Some respondents didn't get either vaccine,
others got only one, and some got both. This is formulated as a multilabel (and not multiclass) problem.
The features in this dataset
You are provided a dataset with 36 columns. The first column respondent_id is a unique and random identifier. The remaining 35 features are described below.
For all binary variables: 0 = No; 1 = Yes.
1. h1n1_concern - Level of concern about the H1N1 flu.
a. 0 = Not at all concerned; 1 = Not very concerned; 2 = Somewhat concerned; 3 = Very concerned.
2. h1n1_knowledge - Level of knowledge about H1N1 flu.
a. 0 = No knowledge; 1 = A little knowledge; 2 = A lot of knowledge.
3. behavioral_antiviral_meds - Has taken antiviral medications. (binary)
4. behavioral_avoidance - Has avoided close contact with others with flu-like symptoms. (binary)
5. behavioral_face_mask - Has bought a face mask. (binary)
6. behavioral_wash_hands - Has frequently washed hands or used hand sanitizer. (binary)
7. behavioral_large_gatherings - Has reduced time at large gatherings. (binary)
8. behavioral_outside_home - Has reduced contact with people outside of own household. (binary)
9. behavioral_touch_face - Has avoided touching eyes, nose, or mouth. (binary)
10. doctor_recc_h1n1 - H1N1 flu vaccine was recommended by doctor. (binary)
11. doctor_recc_seasonal - Seasonal flu vaccine was recommended by doctor. (binary)
12. chronic_med_condition - Has any of the following chronic medical conditions: asthma or an other lung condition, diabetes, a heart condition, a kidney condition, sickle cell anemia or other anemia, a neurological or neuromuscular condition, a liver condition, or a weakened immune system caused by a chronic illness or by medicines taken for a chronic illness. (binary)
13. child_under_6_months - Has regular close contact with a child under the age of six months. (binary)
14. health_worker - Is a healthcare worker. (binary)
15. health_insurance - Has health insurance. (binary)
16. opinion_h1n1_vacc_effective - Respondent's opinion about H1N1 vaccine
effectiveness.
a. 1 = Not at all effective; 2 = Not very effective; 3 = Don't know; 4 = Somewhat effective; 5 = Very effective.
17. opinion_h1n1_risk - Respondent's opinion about risk of getting sick with H1N1 flu
without vaccine.
a. 1 = Very Low; 2 = Somewhat low; 3 = Don't know; 4 = Somewhat high; 5 =
Very high.
18. opinion_h1n1_sick_from_vacc - Respondent's worry of getting sick from taking
H1N1 vaccine.
a. 1 = Not at all worried; 2 = Not very worried; 3 = Don't know; 4 = Somewhat worried; 5 = Very worried.
19. opinion_seas_vacc_effective - Respondent's opinion about seasonal flu vaccine
effectiveness.
a. 1 = Not at all effective; 2 = Not very effective; 3 = Don't know; 4 = Somewhat effective; 5 = Very effective.
20. opinion_seas_risk - Respondent's opinion about risk of getting sick with seasonal
flu without vaccine.
a. 1 = Very Low; 2 = Somewhat low; 3 = Don't know; 4 = Somewhat high; 5 =
Very high.
21. opinion_seas_sick_from_vacc - Respondent's worry of getting sick from taking
seasonal flu vaccine.
a. 1 = Not at all worried; 2 = Not very worried; 3 = Don't know; 4 = Somewhat worried; 5 = Very worried.
22. age_group - Age group of respondent.
23. education - Self-reported education level.
24. race - Race of respondent.
25. sex - Sex of respondent.
26. income_poverty - Household annual income of respondent with respect to 2008 Census poverty thresholds.
27. marital_status - Marital status of respondent.
28. rent_or_own - Housing situation of respondent.
29. employment_status - Employment status of respondent.
30. hhs_geo_region - Respondent's residence using a 10-region geographic classification defined by the U.S. Dept. of Health and Human Services. Values are represented as short random character strings.
31. census_msa - Respondent's residence within metropolitan statistical areas (MSA) as defined by the U.S. Census.
32. household_adults - Number of other adults in household, top-coded to 3.
33. household_children - Number of children in household, top-coded to 3.
34. employment_industry - Type of industry respondent is employed in. Values are represented as short random character strings.
35. employment_occupation - Type of occupation of respondent. Values are represented as short random character strings.
![]()
Feature data example
For example, a single row in the dataset, has these values:
Field Value
|
h1n1_concern |
1 |
|
h1n1_knowledge |
0 |
|
behavioral_antiviral_meds |
0 |
|
behavioral_avoidance |
0 |
|
behavioral_face_mask |
0 |
|
behavioral_wash_hands |
0 |
|
behavioral_large_gatherings |
0 |
|
behavioral_outside_home |
1 |
|
behavioral_touch_face |
1 |
|
doctor_recc_h1n1 |
0 |
|
doctor_recc_seasonal |
0 |
|
chronic_med_condition |
0 |
|
child_under_6_months |
0 |
health_worker 0
Field Value
|
health_insurance |
1 |
|
opinion_h1n1_vacc_effective |
3 |
|
opinion_h1n1_risk |
1 |
|
opinion_h1n1_sick_from_vacc |
2 |
|
opinion_seas_vacc_effective |
2 |
|
opinion_seas_risk |
1 |
|
opinion_seas_sick_from_vacc |
2 |
|
age_group |
55 - 64 Years |
|
education |
< 12 Years |
|
race |
White |
|
sex |
Female |
|
income_poverty |
Below Poverty |
|
marital_status |
Not Married |
|
rent_or_own |
Own |
|
employment_status |
Not in Labor Force |
hhs_geo_region
oxchjgsf
Field Value
|
census_msa |
Non-MSA |
|
household_adults |
0 |
|
household_children |
0 |
|
employment_industry |
NaN |
employment_occupation
NaN
2. Hand Gesture Recognition Data Set – You will need to collect this data yourself
Please download this app to your smartphonehttps://phyphox.org/
Please collect gesture data - 4 classes/ categories
1. Moving your phone in a circle
2. Waving
3. Gesturing “come here”
4. Gesturing “go away”
For recording the gesture data from the phyphox app, please use Acceleration (without g).
Do each gesture continuously for 15 iterations (without stopping). Make 5 sets (files/recordings) for each gesture: Circle, Wave, Come Here, Go Away.
Each student should create a data set and then you can use one student’s set for training and the other for testing – or mix them up.
You will need to decide how many iterations of each gesture you will use to indicate the gesture (3 or 4 iterations).
3. Pump it Up: Data Mining the Water Table
https://www.drivendata.org/competitions/7/pump-it-up-data-mining-the-water-table/
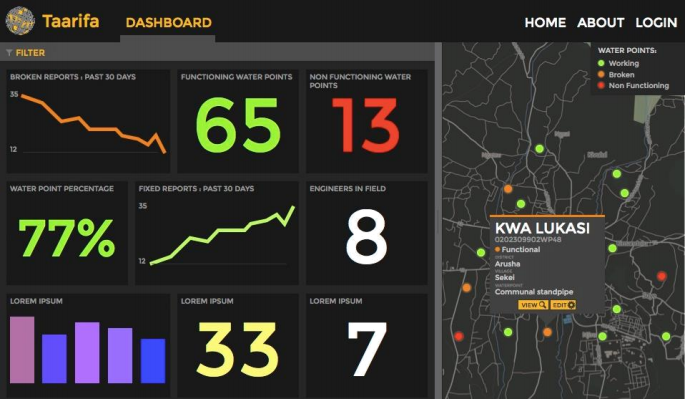
The data comes from the Taarifa waterpoints dashboard, which aggregates data from the Tanzania Ministry of Water.Taarifais an open source platform for the crowd sourced reporting and triaging of infrastructure related issues.
Can you predict which water pumps are faulty? Using data fromTaarifaand the Tanzanian Ministry of Water, can you predict which pumps are functional, which need some repairs, and which don't work at all? This is an intermediate-level practice competition. Predict one of these three classes based on a number of variables about what kind of pump is operating, when it was installed, and how it is managed. A smart understanding of which waterpoints will fail can improve maintenance operations and ensure that clean, potable water is available to communities across Tanzania. Think of it as a bug tracker for the real world which helps to engage citizens with their local government. We are currently working on an Innovation Project in Tanzania, with various partners.
The features in this dataset
Your goal is to predict the operating condition of a waterpoint for each record in the dataset. You are provided the following set of information about the waterpoints:
1. amount_tsh - Total static head (amount water available to waterpoint)
2. date_recorded - The date the row was entered
3. funder - Who funded the well
4. gps_height - Altitude of the well
5. installer - Organization that installed the well
6. longitude - GPS coordinate
7. latitude - GPS coordinate
8. wpt_name - Name of the waterpoint if there is one
9. num_private -
10. basin - Geographic water basin
11. subvillage - Geographic location
12. region - Geographic location
13. region_code - Geographic location (coded)
14. district_code - Geographic location (coded)
15. lga - Geographic location
16. ward - Geographic location
17. population - Population around the well
18. public_meeting - True/False
19. recorded_by - Group entering this row of data
20. scheme_management - Who operates the waterpoint
21. scheme_name - Who operates the waterpoint
22. permit - If the waterpoint is permitted
23. construction_year - Year the waterpoint was constructed
24. extraction_type - The kind of extraction the waterpoint uses
25. extraction_type_group - The kind of extraction the waterpoint uses
26. extraction_type_class - The kind of extraction the waterpoint uses
27. management - How the waterpoint is managed
28. management_group - How the waterpoint is managed
29. payment - What the water costs
30. payment_type - What the water costs
31. water_quality - The quality of the water
32. quality_group - The quality of the water
33. quantity - The quantity of water
34. quantity_group - The quantity of water
35. source - The source of the water
36. source_type - The source of the water
37. source_class - The source of the water
38. waterpoint_type - The kind of waterpoint
39. waterpoint_type_group - The kind of waterpoint
Feature data example
For example, a single row in the dataset might have these values:
|
amount_tsh |
300.0 |
|
date_recorded |
2013-02-26 |
|
funder |
Germany Republi |
|
gps_height |
1335 |
|
longitude |
37.2029845 |
|
latitude |
-3.22870286 |
|
wpt_name |
Kwaa Hassan Ismail |
|
num_private |
|
2023-03-07