MIS3003S Business Analytics
Hello, dear friend, you can consult us at any time if you have any questions, add WeChat: daixieit
MIS3003S Business Analytics
BBS36FT Group Project
February 2023
1 Introduction
The purpose of this assignment is to apply the knowledge you have acquired so far in this module to a real- world scenario. This is a group assignment. It facilitates application of several techniques, namely linear regression, time-series analysis, and linear programming, and serves to evaluate your ability to use Excel, and interpret and present Business Analytics results.
2 Financial Data
Buying and selling of stocks (or bonds and other securities) is a potentially profitable business, but without proper analytics, it can lead to big financial losses.
When designing a stock portfolio, some of the decisions to take are:
● The capital to invest;
● The risk the investor is willing to take;
● The time the investor will wait for his/her returns.
The use of analytics methods can help with some of these decisions.

3 Assignment Description
This project is a (simple) simulation of modelling and optimising an investment portfolio, stated as follows: After a strong finish in 2021, hitting record values, most market indices entered a declining period in 2022, further motivated by the conflict in Ukraine and the resulting energy crisis, leading to values of inflation not seen in decades . However, by early summer months, some signs of a recovery were observed. In order to carefully profit from this scenario, you were tasked with setting up a portfolio of companies, modelling their price behaviour, and optimising a two-week investment strategy, from the 1st August 2022 to the 12th August 2022, while subject to specific risk constraints .
3.1 Establish a Portfolio of Companies
Your portfolio must be composed of twice as many companies as there are members in your group (e.g. eight companies for a group of four members). The first letter of the Ticker Code of each company must match the first letter of each of your team member’s first (given) name, as registered with UCD. For example, Grace Hopper can choose GES (Guess, Inc) or GM (General Motors Company), while Alfred Kinsey can choose ACN (Accenture plc) or AXP (American Express Company).
All companies must trade on the New York Stock Exchange (NYSE).
3.2 Data Gathering
Download daily data for each of your companies, for the period from the 27th June 2022 until the 29th July 2022 (inclusive). Based on performance during this period, choose companies likely to give a positive return on investment. Acquire your data from Yahoo Finance: http://finance .yahoo .com/ 1
3.3 Descriptive Analytics
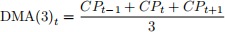
For each company, start by sequentially numbering each daily entry as a Trading Day (TD) (i.e. data for the 27th June 2022 is TD = 1). Next, you must calculate the 3-day Displaced Moving Average (DMA(3)) of the Closing Price (CP). The DMA(3) at day t is calculated as follows:
 (1)
(1)
where CPt − 1 is the CP for the previous day, etc. Start your calculations at t = 2, and finish at t = n - 1, i.e. do not calculate a DMA(3) for the first and last days of your training data.
Finally, to visualise the data, create a line plot of TD versus CP, for the period from TD=1 until TD=24, with a second line (in the same plot) showing the calculated DMA(3) data.
3.4 Predictive Analytics
For each company, perform linear regression on the DMA(3) data, using TD as the predictor. Use the period from the 28th June 2022 until the 28th July 2022 (inclusive) as your training data.
Report the predicted Daily Price Increase (DPI) of each company, as the slope of the calculated model, along with the train RMSE and R2 of the model.
3.5 Prescriptive Analytics
The strategy you will employ relies on deciding how many days to invest in each company .
● The objective is to maximise the expected return of the investment:
– The expected return of each company is calculated by multiplying the predicted DPI of that company by the number of shares bought for the company, and multiplying the result by number of days of investment in the company.
– Add the expected return of investment figures for all companies, to obtain the total expected return of the investment.
● You will optimise how many days to invest in each company:
– Ensure that the number of days of investment is a whole number, through the use of Integer Linear Programming in Excel.
In order to control the risk of your investment strategy, use the following constraints:
● Invest no more than 10 * R2 days in each company, where R2 is the training Coefficient of Determi- nation, calculated in Section 3.4.
● Invest as close to $15,000 (US Dollars) per company as possible.
– Calculate the number of shares bought for each company based on this constraint and its latest CP figure. For example, if company ABCDE’s closing price on the 29th July 2022 was $900, then you can buy 16 shares of that company.
● For a portfolio with P companies, invest no more than an average of $5,000 * P per day, across all 10 days of investment.
Calculate the optimum point (number of days to invest in each company), using Linear Programming. Report your solution, along with the total amount invested, and the total expected return.
Report the actual return of the investment using real data:
● Download the actual market data for the investment period (1st August 2022 to 12th August 2022), and calculate the actual return for the investment period.
– Use the Open Price of the 1st August 2022 as the stock price for each company, while ensuring that you are still investing as close to $15,000 per company2 .
– Use the Closing Price corresponding to the last investment day (e.g. 8th August 2022 for a company in which you invested 6 days).
– The profit per company is then simply calculated as (CP - OP) x#shares bought.
– Compare and analyse the difference between both figures.
4 Deliverables
4.1 Mandatory
Your deliverable will consist of a PDF Document:
1. The following is expected:
(a) One professionally looking cover page, including an appropriate report title, authors (name and
student ID), module name and code, and your Project Group Number;
● It must also contain a short paragraph (200 words or less) stating each member’s contribution, and the following statement: “This document is all our own work. We have not shown this file to any student outside the group.”;
(b) One introduction page, describing the contents, main results and conclusions of your report;
(c) One page analysis per stock composing your portfolio, including company name and ticker code, a one-paragraph introduction to the company, the requested time-series plot (see Section 3.3), a verbal analysis of its share price behaviour for that period (and possible causes), the resulting model, the training RMSE and R2 for the model, the calculated DPI, and the number of stocks that can be bought for this company.
(d) Up to three pages detailing your optimisation, including:
● A description of your setup, including objective function, decision variables, and constraints;
● A clear description of the solution proposed;
● An analysis of your predicted profit and the observed profit, including a critical discussion of the limitations of the analytics methods applied.
2. The document must be at most thirteen pages long (fifteen for 5-people groups): this includes the cover page and all graphics, but does not include an optional reference list;
3. No table of contents and/or appendixes of any form are allowed.
You must also submit a Microsoft Excel spreadsheet:
1. Include all your data and calculations;
2. Use one Excel tab per company (identified by its ticker code), and an extra tab for the optimisation;
3. Label cells carefully, to make it clear where objective function, constraints, and solution are.
4. Use cell references wherever possible, instead of copying values around.
5. Your Excel spreadsheet will be checked to see how your plots were made and if calculations were done correctly, so make sure that you submit the actual spreadsheet where you did all your work (including Solver setup).
Pay attention to the following requirements concerning your submission:
● Write your PDF document as a report of your findings to the investors (in other words, do not write it as a school report). Do not make any references to formulas, calculations, cells, or implementation details of your Excel workbook: your report must be self-contained.
● Submit two separate files: your PDF report and a single Excel workbook. Do not submit a zip file .
● Criteria for evaluation include clarity of presentation, document consistency demonstrating team work, capacity to succinctly describe all findings, and critical analysis of results and methodology.
● You will not be evaluated based on the performance of your portfolio, but rather on correct simulations and calculations.
● Any changes to the specified methodology must be discussed with the lecturer first, and properly justified in the document.
4.2 Optional
You can also attempt extra credits for your project with the following optional objectives.
● Compare your company data to the composite index “NYSE Composite (DJ)” (ticker code ˆNYA)3 :
1. Include a line of the CP of the index in each company plot, for the full training period, using a secondary vertical axis.
2. For each company, calculate the correlation between its CP and the index CP, for the full training period. Include this figure in each company page.
● Relate your model to the composite index:
4. Create a linear regression model of the index CP given the TD, for the full training period. Then scale the slope of the model (b) as follows:
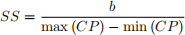
where SS is the Scaled Slope value. Calculate the SS values for each company as well, using the models created in Section 3.4. Finally, calculate an Adjusted Scaled Slope (ASS) for each company, as the SS of the company minus the SS of the index. Report this value in each company page.
● Adjust your optimisation with the composite index:
5. Allow one extra day of investment for each company with a positive ASS value.
6. Adjust the maximum amount to invest in each company to be $15,000*(1 + ASS).
No extra pages are allowed, even if you attempt any of the optional objectives mentioned. Incorporate the extra objectives you attempted into your project (i.e. do not provide two implementations, a “standard” one and an “extra” one).
Do not attempt any techniques not mentioned in this project specification, without discussing those with the lecturer first.
5 Submission
● Deadline for submission is Sunday 19th March 2023 at 11:59pm Irish time. Both your PDF file and your Excel file must be submitted through Brightspace by the deadline.
● You are free to discuss your assignment with other students, but not to look at any other group’s work, or show your work to any student outside your group. If you use quotes or paraphrases, images, or ideas from outside sources, you must give a citation.
● Plagiarism, including accidental plagiarism, may result in penalties including grade penalties, failure of the module, and disciplinary action:
http://libguides.ucd.ie/academicintegrity/plagiarismandwriting
● Please be advised that your online submission will be checked with Brightspace’s plagiarism detector.
2023-03-06