BUSS511 – Introduction to Programming for Business Analytics
BUSS511 – Introduction to Programming for Business Analytics
Semester 1 2021
Introduction to Programming for Business Analytics
Final Assignment for Semester 1, 2021
Due Date: Sunday, 13 June, 11pm
Instructions:
1. You are to conduct analyses on the dataset provided and translate it into a written report.
2. 20% of your marks will be based on the report that you wrote and another 20% from the Python script.
3. The report uses font type: Times New Roman (12pt & 1.5 spacing) and must not exceed four pages.
4. Attach your Python script at the end of the report as an Appendix (no page limit for scripts).
5. Submit your written report through Turnitin on Blackboard before the due date.
This assessment uses data obtained from spotifycharts.com which contains the daily top 200 songs streamed on Spotify New Zealand in the year 2020. On Blackboard, you are provided with monthly files, from “Jan20.csv’ all the way to “Dec20.csv”. Each of these files contains information such as the song title, the artist name, and the total number of streams. Each file also contains various audio features for each of the songs such as loudness, danceability, acousticness, and valence.
The objectives of this assessment are as follows: (1) Data handling by combining multiple datasets, (2) Visualize the total Spotify usage in New Zealand over time, (3) Tabulate the most popular songs and artists based on the number of streams, and (4) Analyze trends in valence over time.
Task 1: Write a loop to concatenate (vertically) each of the monthly files to form one big file. Call this big file as ‘full_data’. Using this data, compute the following statistics for the year 2020 and report them as Table 1:
(a) total number of observations,
(b) total unique songs,
(c) total streams, and
(d) average stream per unique song.
Task 2: Using ‘full_data’, apply groupby to calculate the total daily streams over the year 2020 and then plot them as Figure 1 using matplotlib.
Task 3: Using ‘full_data’, calculate the total streams over the year 2020 by grouping the data by “Track.Name”. Sort the songs based on the total streams and select the top 5 songs streamed for the year. Next, calculate the total streams over the sample period by grouping the data by “Artist”. Sort the artist based on the total streams and select the top 5 artists streamed. In total, you should have 5 most listened songs and 5 most listened artists. Report them as Table 2.
Task 4: Valence measures a song’s musical positivity. It ranges from 0 and 1. Songs with high valence (closer to 1) sound more positive (e.g., happy, cheerful, euphoric), while songs with low valence (closer to 0) sound more negative (e.g., sad, depressed, angry).
Using the column “valence” in the file ‘full_data’, apply groupby and calculate the average valence for each day. Check the trend for valence over time, i.e. plot the average valence from 1 January 2020 to 31 December 2020 as Figure 2.
After completing the above tasks, you should have two tables and two figures in total. Make a written report of these findings (one page for each task). This report is to be written professionally, and effort should be made to explain and substantiate your findings. Your Python script is to be attached at the back of the report as an Appendix. This written report is to be submitted online through Turnitin on Blackboard.
The marking criteria is provided on the next page.
===End of assessment===
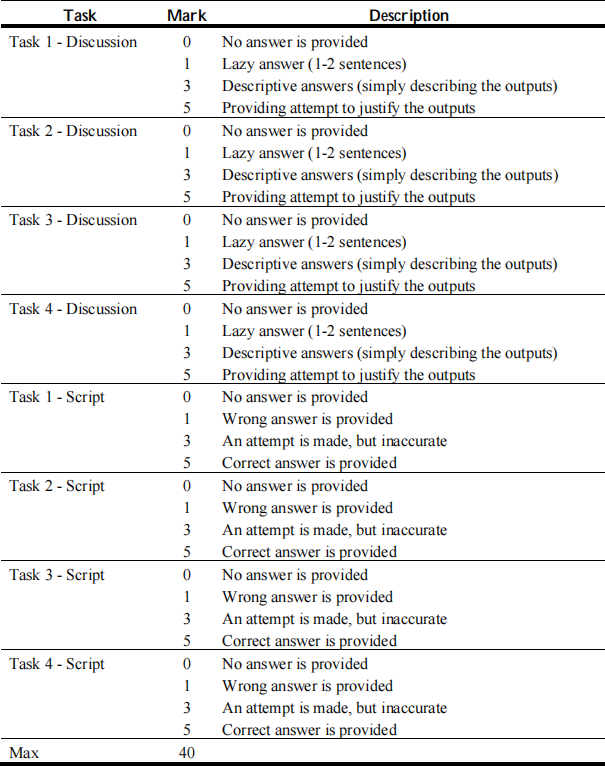
Marking criteria - Final assignment
2021-06-08