Programming Project 3
Hello, dear friend, you can consult us at any time if you have any questions, add WeChat: daixieit
Programming Project 3
February 2023
For your third programming project for Introductory Scientific Computing you will write code to analyse and present a new data set. There is one option available for this assessment and this is detailed below. This will be worth 15% of your total unit mark. The deadline for this work is Wednesday, 1st March at 10am (Week 18).
To use Noteable to complete your assessment, you should create a new Jupyter Notebook. After completion, the Notebook should be downloaded from Noteable and uploaded to the submission point. For a short demo, see the video available on the Blackboard “Access Python” page entitled “Create new notebooks and download files”. You can use an alternative tool, if you prefer, as long as your file contains Python code only and can be run using a Python interpreter (“.ipynb” or “ .py”file or files). Please ensure that your code is submitted in one of these two formats (“.ipynb” or“ .py”file or files) otherwise the submission will not be accepted.
For the code document produced, this should include all the Python code used to perform the coding task outlined below including plots (either within the Jupyter notebook or referenced as external files and also submitted). The code document should be self-contained, and it should be made clear which parts of the analysis are being performed at each stage. The code should be well commented and additional details can also be added using separate markdown cells (available within Jupyter notebooks). The code document should be able to run as a whole (from start to finish in order).
When completed, use the “Programming project 3”Blackboard submission point to upload your file (or files) (on the “Assessment, submission and feedback”course content area).
1 Project details
1.1 Examining the geometry of molecules
Molecular geometry is the three-dimensional arrangement of atoms within a molecule. This geom- etry is often described by considering the lengths and angles of the bonds within the system. If we consider a central atom with 4 bonds to other atoms / molecules these are two of the three- dimensional shapes this system could take: either a Square planar shape, as shown in Fig. 1, or a Tetrahedral shape, as shown in Fig. 2.
Both the Square Planar and Tetrahedral shapes are symmetric when they are rotated (rotationally symmetric) and in an ideal system:
• For the square planar shape, each of the four bonds (along the plane) has an angle of 90o
• For the tetrahedral shape, each of the four bonds has an angle of 109.5o
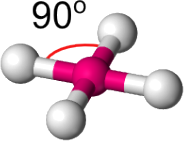
Figure 1: A molecule in a square planar shape. The angle between each bond on the plane is 90o in an ideal system.
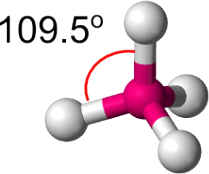
Figure 2: A molecule in a tetrahedral shape. The angle between each bond is 109 .5o in an ideal system.
For this project, we have provided two data files containing the measured bond angles for different systems with a central atom and four surrounding bonds (to other atoms or molecules).
1. With the Rhodium (Rh) element as the central atom
2. With the Cobalt (Co) element as the central atom
In both cases, we expect the majority of these systems to be either Square Planar (all angles on the plane of 90o ) or Tetrahedral (all angles of 109.5o ) in shape.
Here are the first 5 rows of the first data file, “Rh CN4-molecules.csv”:
# Missing entries are shown as -999 value .
Query,Refcode,ANG1,ANG2,ANG3,ANG4,R-factor,Study Temp .
1,ABANEX,86 .286,91 .877,91 .402,90 .744,4 .110,150
1,ABEJIA,98 .505,100 .045,83 .356,79 .567,4 .160,120
1,ABEJOG,100 .686,99 .261,78 .550,82 .795,3 .910,120
Here are the first 5 rows of the second data file, “Co CN4-molecules.csv”:
# Missing entries are shown as -999 value .
Query,Refcode,ANG1,ANG2,ANG3,ANG4,R-factor,Study Temp .
2,ABEBUG,107 .775,104 .241,106 .684,115 .986,2 .920,150
2,ABECER,119 .168,107 .584,103 .463,105 .580,4 .860,150
2,ABECIV,109 .473,104 .126,109 .126,120 .683,3 .330,150
Within both of these data files the column details are as follows:
• ‘Query’ - Database query number
• ‘Refcode’ - Reference code for the molecular structure
• ‘ANG1’, ‘ANG2’, ‘ANG3’, ‘ANG4’- Values in degrees for each of the four bond angles
• ‘R-factor’ - Reliability factor. This is a measure of the quality of the data where a lower value is better
• ‘Study Temp . ’- Temperature used when completing the measurements.
1.3 Assessment
The aim of this project is to examine these data files and see how well these two different molecular shapes (Square Planar and Tetrahedral) can be distinguished within this data using the ideal angles.
1.3.1 Overall properties
The first part of this assessment deals with reading, manipulating and plotting the data to show the overall details for the bond angles.
Assessment, Part 1: Read the “Rh CN4-molecules.csv” and “Co CN4- molecules.csv” data sets, analyse the bond angles and plot the distributions.
1. Using Python, read the data from these files considering the following:
• How the data files are laid out and how best to read the data
• How to handle any missing data
2. Consider the average and spread of the bond angles for both data sets
• Calculate the mean for each molecule (row) across all four bond angle columns (i.e. total divided by 4). You may wish to add this as an additional column.
• For this new column (Series), calculate the mean and standard deviation and compare these values against the ideal angles for the Square Planar (90o ) and
Tetrahedral shapes (109.5o ). Use clear print statements and/or text (markdown) cells.
3. From these data sets, create at least one plot to show the distribution of these bond angles considering:
• How to present this data in a clear way
• How to make sure the plot(s) are self-contained and include all the relevant information
1.3.2 Individual molecules
After looking at the properties of the data sets as a whole, we can consider what this tells us about individual molecules and whether we are able to make any predictions of the shape.
Assessment, Part 2: Based on your analysis so far, predict the most likely shape for individual molecules.
1. Select a set of molecules (rows) using the ‘Refcode’ values and predict their shape
• Find the molecules with these ‘Refcode’ values:
– ‘YIQQUK’ (Rh)
– ‘ZOJPUJ01’ (Co)
– ‘ICAYES’ (Co)
– ‘ZABVIK’ (Co)
• Based on the bond angles, comment on the likelihood of each of these molecules having a Square planar or Tetrahedral shape. Use clear print statements and/or text (markdown) cells.
2. For the Cobalt (Co) data, add a column predicting whether the most likely shape of each molecule (row) is Square planar. One way to approach this is the following:
• Based on your analysis so far, choose a cut off value for your mean bond angle below which you may expect the most likely shape to be Square planar.
• Create a new column indicating whether each molecule (row) is predicted to be Square planar (e.g. containing True/False values).
• Check this aligns with your predictions of individual molecules in the previous question.
2023-02-24